import yfinance as yf
import matplotlib.pyplot as plt
import pandas as pd
# List of companies and their ticker symbols
companies = {
"NVIDIA": "NVDA",
"TSMC": "2330.TW",
"Broadcom": "AVGO",
"ASML": "ASML",
"Samsung Electronics": "005930.KS",
"AMD": "AMD",
"Qualcomm": "QCOM",
"Texas Instruments": "TXN",
"Applied Materials": "AMAT",
"Arm Holdings": "ARM",
"Micron Technology": "MU",
"Analog Devices": "ADI",
"Lam Research": "LRCX",
"KLA": "KLAC",
"Intel": "INTC",
"SK Hynix": "000660.KS",
"Tokyo Electron": "8035.T",
"Synopsys": "SNPS",
"Marvell Technology": "MRVL",
"MediaTek": "2454.TW"
}
# Conversion rates
conversion_rates = {
'TSMC': 0.032,
'Samsung Electronics': 0.00074,
'ASML': 1.1,
'Tokyo Electron': 0.0067,
'SK Hynix': 0.00074,
'MediaTek': 0.032
}
# Define company groups
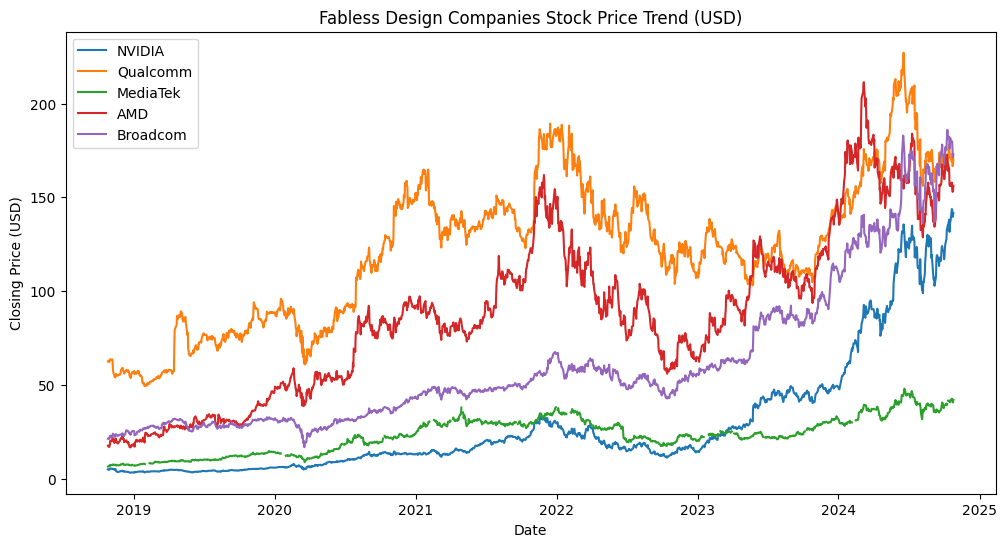
fabless_design = ["NVIDIA", "Qualcomm", "MediaTek", "AMD", "Broadcom"]
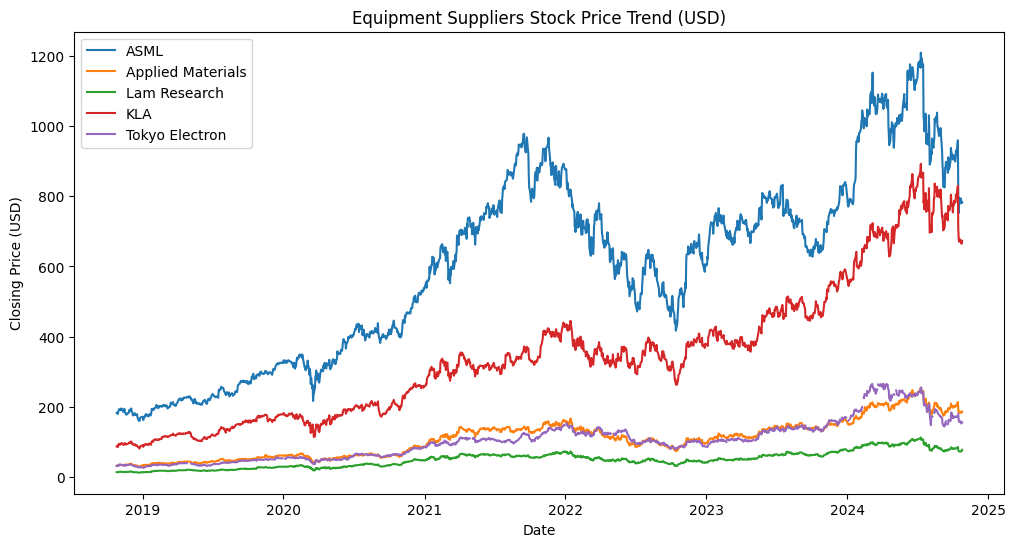
equipment_suppliers = ["ASML", "Applied Materials", "Lam Research", "KLA", "Tokyo Electron"]
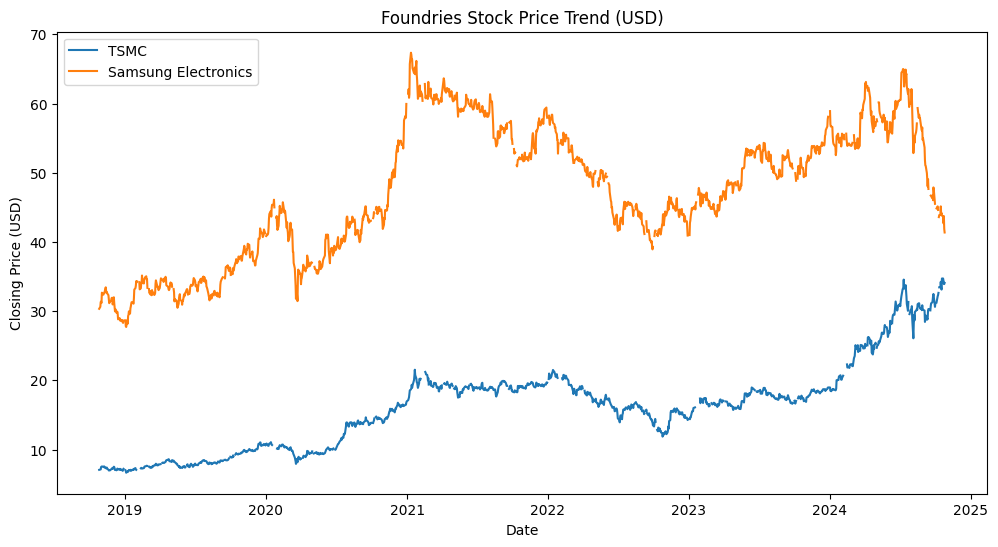
foundries = ["TSMC", "Samsung Electronics"]
idm_companies = ["Samsung Electronics", "Intel", "Texas Instruments", "SK Hynix", "Micron Technology"]
# Function to download, convert to USD, and return data
def download_and_convert(companies, conversion_rates, start="2018-10-26"):
converted_data = pd.DataFrame()
for company, ticker in companies.items():
try:
data = yf.download(ticker, start=start)["Close"]
# Apply conversion rate if the company's stock is in a different currency
if company in conversion_rates:
data *= conversion_rates[company]
converted_data[company] = data
except Exception as e:
print(f"Failed to download {company} ({ticker}): {e}")
return converted_data
# Download and convert data for all companies
all_data = download_and_convert(companies, conversion_rates)
# Function to plot trends for a group
def plot_group_trend(data, group, title):
plt.figure(figsize=(12, 6))
for company in group:
if company in data.columns:
plt.plot(data[company], label=company)
plt.title(title)
plt.xlabel("Date")
plt.ylabel("Closing Price (USD)")
plt.legend()
plt.show()
# Plot each group's trend
plot_group_trend(all_data, fabless_design, "Fabless Design Companies Stock Price Trend (USD)")
plot_group_trend(all_data, equipment_suppliers, "Equipment Suppliers Stock Price Trend (USD)")
plot_group_trend(all_data, foundries, "Foundries Stock Price Trend (USD)")
plot_group_trend(all_data, idm_companies, "IDM Companies Stock Price Trend (USD)")
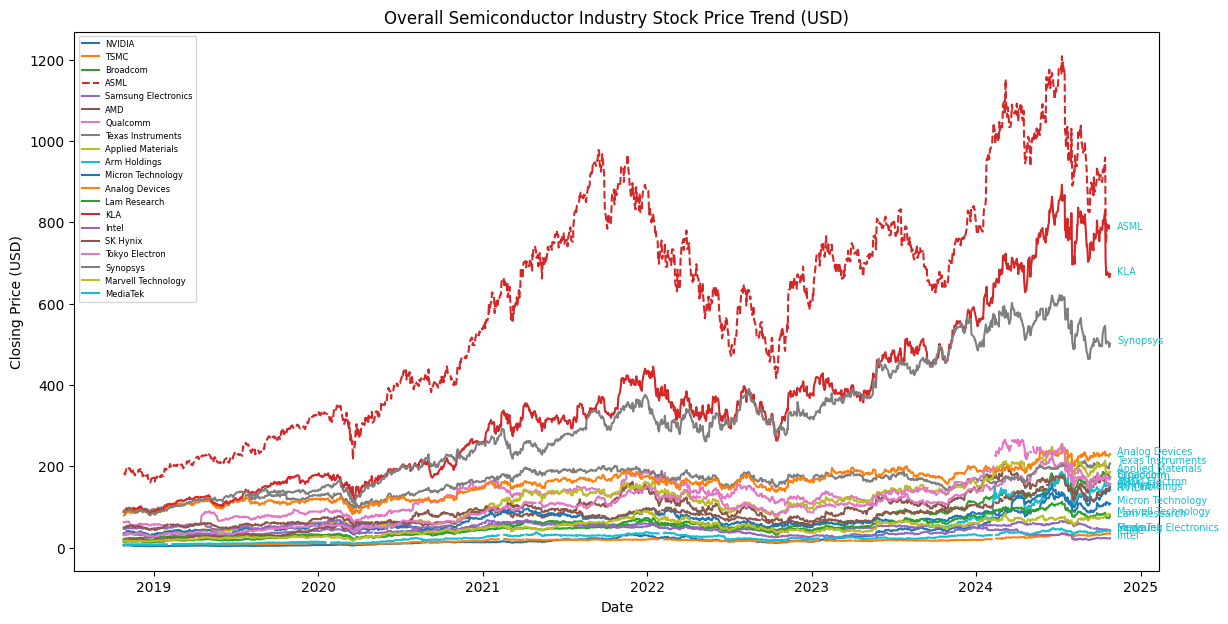
plot_group_trend(all_data, list(companies.keys()), "Overall Semiconductor Industry Stock Price Trend (USD)")
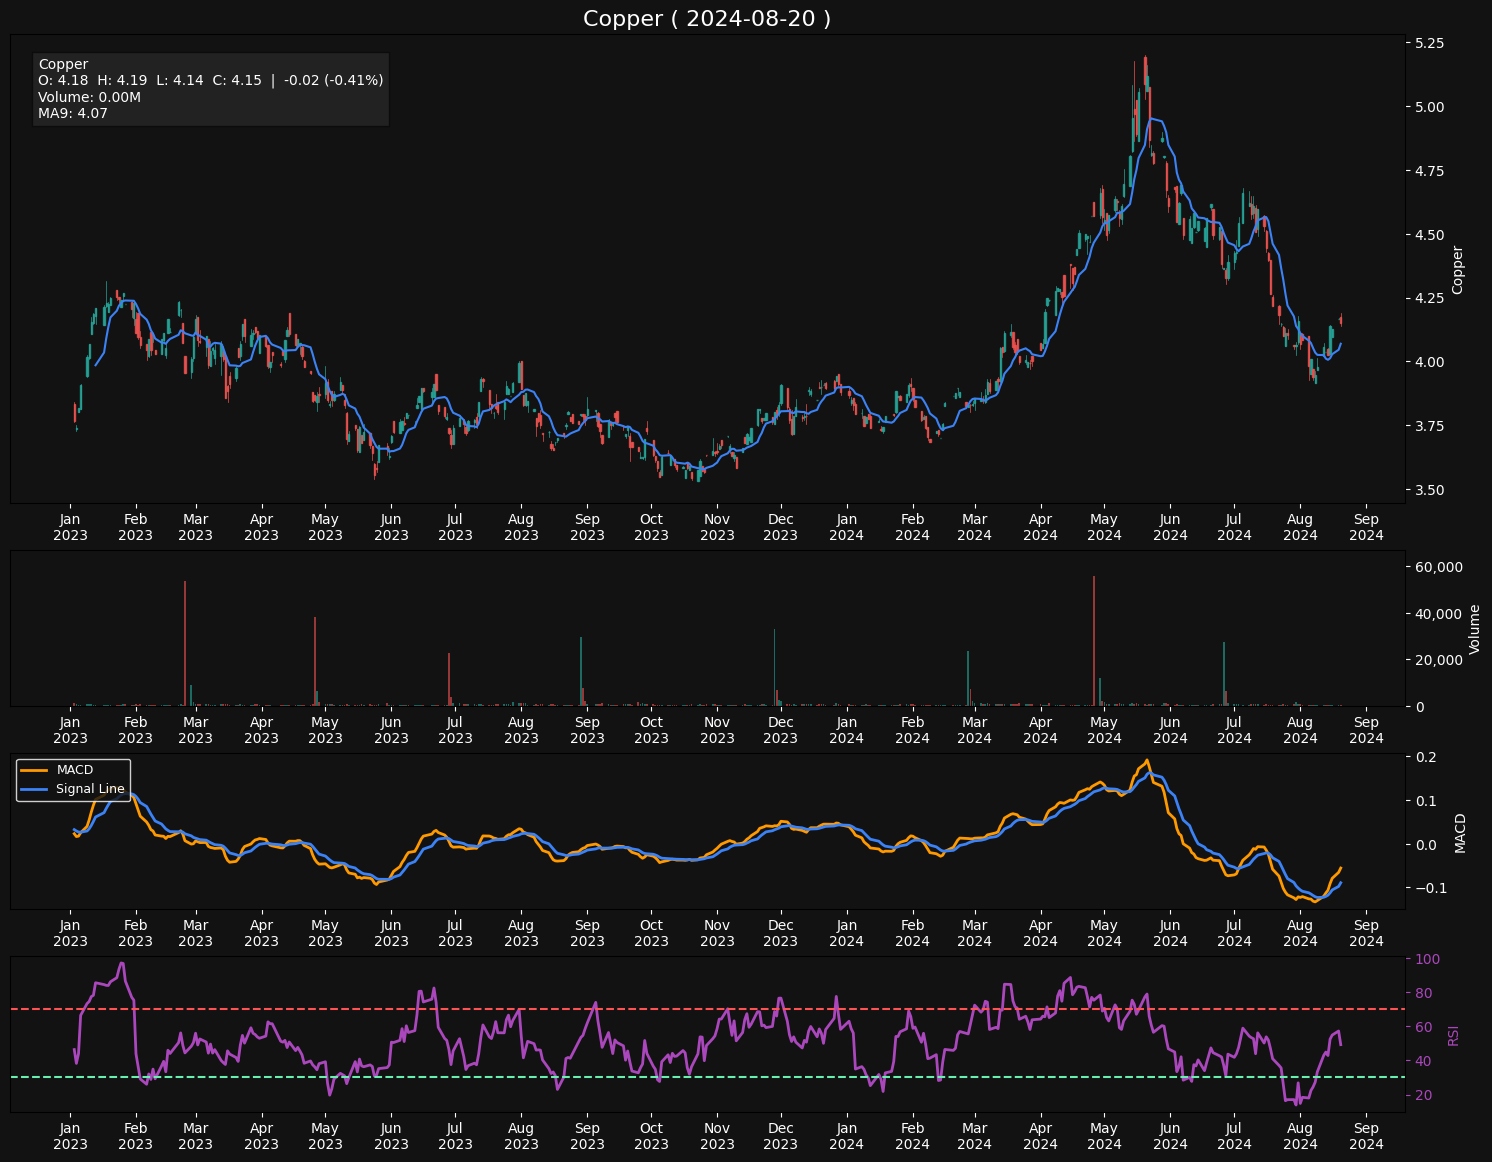 Copper

