Exploring the Kuznets Curve of Alzheimer's Disease (Draft.0624)


update: 2024-06-24
ABSTRACT
This study explores the relationship between economic development and Alzheimer's disease prevalence, conceptualized as the 'Kuznets Curve of Alzheimer's Disease'. Using data from 1990 to 2018 across 183 countries, we analyze the correlation between GDP per capita and Alzheimer's disease prevalence. Our findings reveal an inverted U-shaped relationship: Alzheimer's disease prevalence initially increases with economic growth in low-income countries but decreases as countries reach higher income levels. Improved healthcare access, education, and living conditions in high-income countries contribute to this trend. The study underscores the importance of investing in healthcare infrastructure and public health education in developing countries to mitigate the initial rise in Alzheimer's prevalence.
1. Introduction
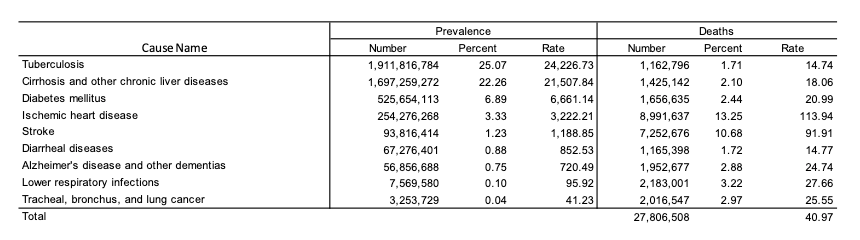
The global disease burden statistics provide deep insights into the serious health challenges facing humanity, highlighting the impact of various diseases on global health. From tuberculosis to diabetes, heart disease to stroke, these data not only reflect current health conditions but also offer crucial information to guide future health policies and actions.
Alzheimer's disease is a significant and growing public health concern, affecting approximately 56.86 million people worldwide. The financial burden is substantial, with the annual cost of care for Alzheimer's patients estimated to account for about 1.1% of global GDP (World Health Organization, 2020). This economic pressure underscores the need for targeted public health interventions and robust healthcare policies.
As economies develop, the prevalence of Alzheimer's disease appears to follow a pattern similar to the Kuznets Curve, which describes the relationship between economic development and income inequality. This curve suggests that income inequality rises during the early stages of economic development, peaks, and then declines as growth continues. Applying this concept to Alzheimer's disease, we hypothesize that the prevalence of Alzheimer's initially increases with economic growth due to improved diagnostic capabilities and an aging population, but eventually decreases in high-income countries due to better healthcare infrastructure and preventive measures.
This study utilizes extensive datasets and various econometric methods to explore this hypothesis. By analyzing the correlation between GDP per capita and Alzheimer's disease prevalence across 183 countries from 1990 to 2018, we aim to provide a comprehensive understanding of the relationship between economic development and Alzheimer's disease. Our findings will inform policymakers on managing the growing burden of Alzheimer's disease in the context of economic growth, emphasizing the need for early investments in healthcare and public health education to mitigate the initial rise in disease prevalence.
Alzheimers Disease
The number and proportion of Americans withAlzheimer’s or other dementias is expected to continue to grow in coming years because the risk of dementia increases with advancing age. The population ofAmericans age 65 and older is projected to grow from 58 million in 2022 to 82 million by 2050 ( Alzheimer’s Association. 2024 Alzheimer’s Disease Facts and Figures. Alzheimers Dement 2024;20.The global prevalence of Alzheimer's disease is estimated to be around 56.86 million people. According to the Alzheimer's Association's 2024 report, the average care cost per patient is $43,644. Therefore, the total global care cost for Alzheimer's disease is estimated to reach $2.4816 trillion. These figures highlight the significant impact of Alzheimer's disease on individuals and society, not only in terms of healthcare resources but also in the psychological and economic burdens on patients and their families.Alzheimer's disease is a progressive neurodegenerative disorder that primarily affects older adults, leading to memory loss, cognitive decline, and behavioral changes. With the global trend of an aging population, the incidence and prevalence of Alzheimer's disease are expected to continue rising.These data underscore the urgent need for increased investment in Alzheimer's research to find more effective treatments and early diagnostic methods. Additionally, comprehensive care and support policies must be developed to alleviate the burden on patients and their families. Governments and healthcare institutions worldwide should collaborate to address this global challenge, improve patients' quality of life, and enhance public health.
Payments for Health Care and Long-Term Care Services for Medicare Beneficiaries
Economic analysis of health care payments reveals stark contrasts in costs for Medicare beneficiaries with and without Alzheimer's disease or other dementias. Based on data from the 2018 Medicare Current Beneficiary Survey, it is evident that traditional fee-for-service Medicare beneficiaries age 65 and older face significantly different financial burdens depending on their cognitive health status.
Cost Analysis in 2023 Dollars
In 2023, the total per-person health care and long-term care payments from all sources for Medicare beneficiaries with Alzheimer’s or other dementias were nearly three times greater than those for beneficiaries without these conditions. Specifically, payments for individuals with dementia averaged $43,644 per person, compared to $14,660 per person for those without dementia (Alzheimer’s Association, 2024).
Nursing Home and Home Care Costs
Additional data from 2019 highlight the high costs associated with nursing home care and formal home care services. On average, nursing home care costs ranged from $90,000 to $100,000 per year. Formal home care services were billed at approximately $23 per hour, leading to an annual cost of around $53,000 for 44 hours of care per week (Chandra et al., 2023).
These figures underscore the substantial economic burden on families and the health care system in managing Alzheimer’s and other dementias. This financial strain necessitates a critical examination of policy and funding mechanisms to support affected individuals and their caregivers adequately. Policymakers and health economists must consider these disparities to develop sustainable health care models that can better address the needs of an aging population with a high prevalence of dementia.
Kuznets Curve
The Kuznets Curve, initially proposed by economist Simon Kuznets in 1955, describes the relationship between economic development and income inequality. The curve hypothesizes that in the early stages of economic development, income inequality rises with industrialization and urbanization, reaching a peak before eventually declining as economic growth continues (Kuznets, 1955). This theoretical model has been widely applied in economic research, and its concepts have gradually extended to the fields of public health and disease statistics.In public health, researchers have begun to explore the application of the Kuznets Curve in explaining health inequalities and disease burdens. Numerous studies indicate that as economies develop, health indicators exhibit a similar inverted U-shaped pattern. For instance, during the early stages of economic development, industrialization and urbanization can lead to drastic changes in lifestyle and environment, potentially increasing the prevalence of infectious and chronic diseases. However, as economic growth progresses, the enhancement of healthcare systems and the implementation of public health policies contribute to a gradual reduction in disease burdens (Egger, Davey Smith, & Grundy, 1995).In disease statistics, the Kuznets Curve has been used to explain the prevalence trends of specific diseases. For example, studies have found that with increasing national income levels, the prevalence rates of cardiovascular diseases and obesity initially rise and then decline. This phenomenon can partly be attributed to lifestyle changes: in the early stages of economic development, dietary shifts and reduced physical activity increase the risks of cardiovascular diseases and obesity. In contrast, during later stages, the dissemination of health education and improvements in healthcare services help to mitigate these risks (Mackenbach, 2012; Popkin, 2001).Similar trends have been observed in research on Alzheimer’s disease and other neurodegenerative disorders. Some studies suggest that as economies develop, the prevalence of Alzheimer’s disease increases in low- and middle-income countries, likely due to advancements in diagnostic techniques and an aging population. Conversely, in high-income countries, early prevention and effective management measures may lead to a stabilization or even a decline in Alzheimer’s disease prevalence (Prince et al., 2015).Furthermore, changes in public health policies significantly influence the application of the Kuznets Curve in the health sector. In many countries, increased investment in healthcare and the promotion of public health awareness contribute to improved population health alongside economic growth. Research shows that as countries reach higher income levels, health inequalities and disease burdens tend to decrease, particularly during periods of economic transition (Wilkinson & Pickett, 2006; Blakely et al., 2005).The application of the Kuznets Curve is further supported by studies on obesity and cardiovascular diseases. For instance, Popkin (1993) pointed out that as countries undergo economic development, dietary habits and physical activity levels change, impacting the prevalence of obesity and related diseases. During the early stages of development, industrialization and urbanization may lead to unhealthy diets and sedentary lifestyles, increasing the risks of obesity and cardiovascular diseases. However, as economic development progresses, the promotion of healthy diets and physical activity helps to reduce these risks (Popkin, 1993; Yusuf et al., 2001).In summary, the Kuznets Curve plays a significant role in explaining public health and disease statistics. Economists, through the analysis of public health data, have demonstrated the importance of balancing economic development with health management policies. This theory reveals the dynamic changes in health inequalities and disease burdens during economic development, providing theoretical support for the formulation of more effective public health policies and interventions. As economies grow, initial industrialization and urbanization tend to exacerbate health inequalities, particularly in low- and middle-income countries. However, with further income growth, these countries can gradually improve their healthcare systems and health management policies, alleviating health inequalities and reducing disease burdens. This process highlights the need for synchronized progress in economic development and public health policies to achieve dual advancement in health and economy.Moreover, the application of the Kuznets Curve highlights the differences in addressing health inequalities and disease burdens across countries and regions. High-income countries, during the later stages of economic development, typically reduce disease burdens and improve health inequalities through comprehensive healthcare systems and effective public health policies. In contrast, low- and middle-income countries need to focus more on building basic healthcare infrastructure and promoting public health education to tackle health challenges associated with economic development. Therefore, future research should conduct in-depth analyses based on specific circumstances to explore health development models suitable for local contexts, emphasizing the importance of targeted interventions at different stages of economic development.
2. Methodology
We assessed public time-series databases for countries, which contain compiled indicators on the prevalence rate of Alzheimer's disease and other dementias, as well as economic conditions such as GDP per capita and healthcare spending. Our study focused on two key variables:
(1) Prevalence rate of Alzheimer's disease and other dementias( Global Burden of Disease data bank,2021)
(2) GDP per capita, PPP(constant 2017 international $)(The World Bank,2021)
Dataset and variable description
| Variable | Measurement unit | Source |
|---|---|---|
| Prevalence Rate of Alzheimer and other dementia | per 100,000 | Global burden of Disease |
| Prevalence Rate of Depressive disorders | per 100,000 | Global burden of Disease |
| Prevalence Rate of Hypertensive heart disease | per 100,000 | Global burden of Disease |
| Mean non-HDL cholesterol trends (crude estimate) | mg/dL | World Health Organization |
| Population ages 65 and above | % | World Bank |
Statistics Description
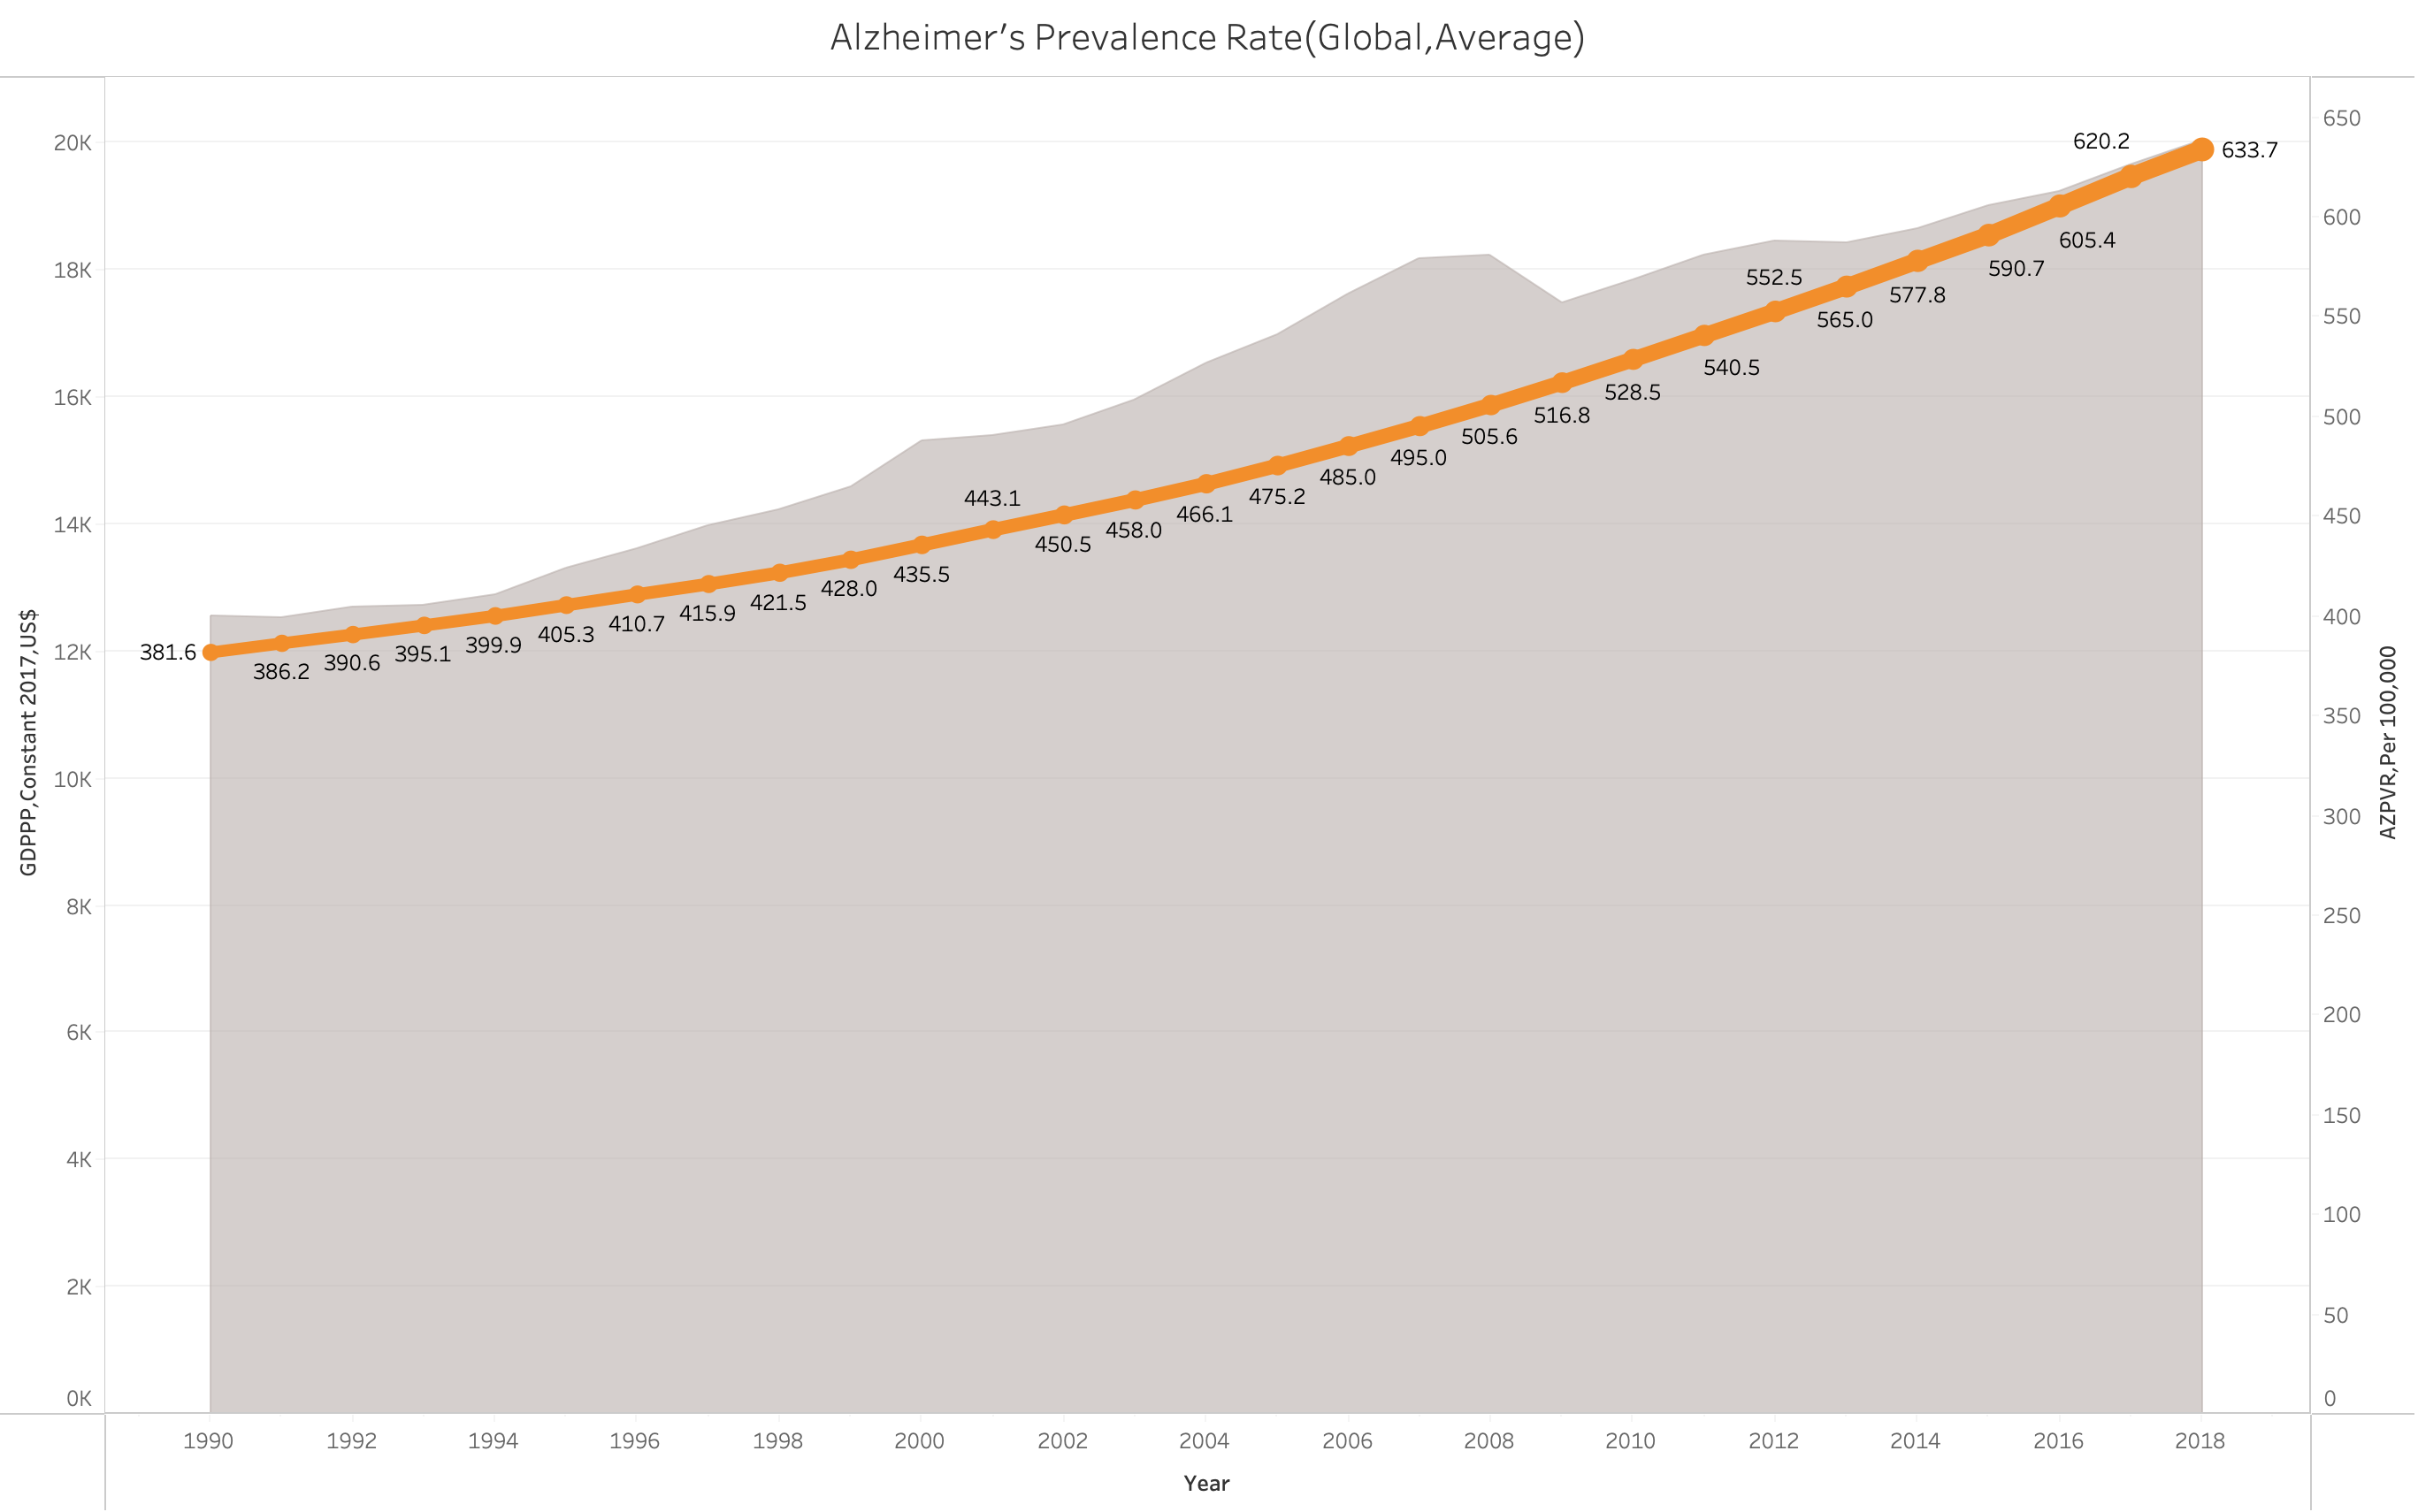
From 1990 to 2018, data from 183 countries show significant growth in both GDP per capita (GDPPC) and the prevalence rate of Alzheimer's disease (PVRAZ). In 1990, the average GDPPC was $12,544, and the average AZPVR was 381.6 cases per 100,000 people. By 2018, both indicators had increased by approximately 60%. Specifically, the average GDPPC rose to $20,035, while the average AZPVR increased to 634 cases per 100,000 people. This trend indicates that as the economy grows, the prevalence of Alzheimer's disease also rises significantly. This increase may be attributed to factors such as population aging, advances in medical diagnostics, and increased awareness of Alzheimer's disease. These data underscore the importance of prioritizing public health issues, particularly the prevention and treatment of chronic diseases, amidst economic development. The concurrent growth in economic and health burdens provides crucial insights for policymakers, highlighting the need for more resources to address the health challenges faced by the aging population while promoting economic progress.
K-Means Clustering
K-means is a widely used unsupervised machine learning algorithm for clustering analysis. Its primary objective is to partition a dataset into K distinct clusters, maximizing the similarity of data points within the same cluster while minimizing the similarity between different clusters. This makes K-means particularly suitable for our study as it allows us to effectively categorize countries based on their economic indicators and Alzheimer's disease prevalence, without requiring labeled data.In this study, the K-means algorithm was applied to classify countries based on their 2018 GDPPC (Gross Domestic Product Purchasing Power Parity) into the following five groups:The use of K-means clustering is particularly apt for our research because it provides a clear, data-driven method to identify patterns and relationships within the complex dataset of economic and health indicators. By grouping countries with similar economic conditions, we can more accurately analyze and interpret the relationship between economic development and the prevalence of Alzheimer's disease, thereby validating the hypothesized Kuznets Curve of Alzheimer's Disease.
- Low Income: ≤ US$ 3,513
- Low-Middle Income: US$ 3,513 – US$ 9,636
- Middle Income: US$ 9,636 – US$ 16,145
- Middle-Upper Income: US$ 16,145 – US$ 34,040
- Upper Income: > US$ 34,040
Preliminary Analysis: Pearson's Correlation Coefficients
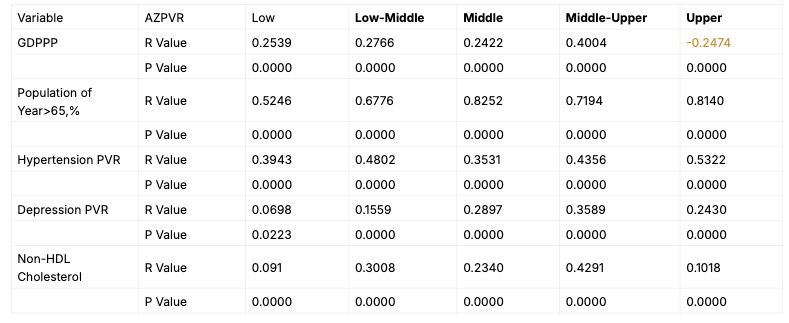
To understand the relationship between GDPPCand the prevalence rate of Alzheimer's disease, we first calculated Pearson's correlation coefficients. This analysis allows us to assess the direction and strength of the linear relationship between these two variables. Our findings indicate a strong positive correlation in the initial stages of economic development (i.e., low to middle upper-income countries), suggesting that as these countries become wealthier, the prevalence rate of Alzheimer's disease also increases. However, as countries transition into higher income categories, the correlation becomes negative, indicating that the prevalence rate of Alzheimer's disease decreases as GDPPC increases.
Time Series Analysis Using Semiparametric Analysis
Semiparametric analysis is an analytical method that combines parametric and nonparametric techniques to provide a more flexible approach to modeling complex relationships. This method is particularly useful when the functional form of the relationship between variables is not fully known or is suspected to be nonlinear. One of the seminal works in semiparametric analysis is by Robinson (1988), who introduced the partially linear model. This model allows for a linear relationship between some variables while modeling the nonlinear relationship between others nonparametrically. This flexibility makes semiparametric methods highly valuable in econometric and epidemiological studies where relationships can be intricate and multifaceted (Härdle & Mammen, 1993).
The semiparametric model we employ can be expressed as:
Yt=Xtβ+g(Zt)+ϵt
where:
- Yt represents the dependent variable at time ttt,
- Xt is a vector of covariates with a linear relationship to Yt,
- g(Zt)is a nonparametric function of the covariates ZtZ_tZt, capturing the potentially nonlinear relationship,
- ϵt is is the error term.
In our study, we employ semiparametric regression to investigate the relationship between economic indicators and the prevalence rate of Alzheimer’s disease over time. By using semiparametric techniques, we can effectively capture the potential nonlinearities in this relationship that a purely parametric model might miss (Ruppert, Wand, & Carroll, 2003). Specifically, we aim to discern the nuanced effects of economic indicators on Alzheimer’s disease prevalence over time, beyond the limitations of traditional linear regression models.
The model we use follows the framework established by Robinson (1988), which is extensively discussed in the literature, such as in the works by Härdle & Mammen (1993) and Ruppert, Wand, & Carroll (2003).
XT Semiparametric Analysis
XT semiparametric analysis is a command used for semiparametric regression models in panel data. This command estimates Baltagi and Li's (2002) series semiparametric fixed effects regression estimator. The main options allow for the use of a classical nonparametric estimator based on an Epanechnikov kernel weighted local polynomial fit or a spline interpolation. The spline interpolation technique yields similar results to the polynomial interpolation but better approximates complex shapes and does not suffer from Runge's phenomenon.
The semiparametric model we employ can be expressed as:
Yit=Xit β+g(Zit)+αi+ϵit
where:
- Yit represents the dependent variable for individual iii at time t,
- Xit is a vector of covariates with a linear relationship to Yit,
- g(Zit) is a nonparametric function of the covariates Zit, capturing the potentially nonlinear relationship,
- αi represents the fixed effects capturing individual-specific heterogeneity,
- ϵit is the error term.
By leveraging XT semiparametric analysis, researchers can accommodate the potential nonlinearities and interactions within their data, providing a more nuanced understanding of the underlying relationships. This method allows for the incorporation of both fixed and random effects, thereby capturing the individual-specific heterogeneity and temporal dynamics that are often present in panel data.
In our application, XT semiparametric analysis is used to explore the relationship between economic indicators and health outcomes across different countries and time periods. This approach enables us to account for the complex, multifaceted nature of the data, offering insights that traditional linear models might overlook. The combination of parametric and nonparametric elements in XT semiparametric analysis ensures a robust and flexible modeling framework suitable for a wide range of econometric and epidemiological studies.
The model we employ is based on the foundational concepts of semiparametric regression discussed by Härdle & Mammen (1993) and extended to panel data analysis as detailed by Baltagi and Li (2002).
3. Result : the Kuzents Curve of Alzheimer’s Disease
Our analysis of data spanning 183 countries from 1900 to 2018 reveals an intriguing pattern regarding the prevalence rate of Alzheimer’s disease (AZ). We observe that in developed countries, the prevalence rate of AZ decreases as income levels increase, indicating a negative correlation between income and AZ prevalence. Conversely, in middle- to low-income countries, we find a contrasting trend where the prevalence rate of AZ tends to increase with rising income levels.
This phenomenon aligns with the concept of the Kuznets Curve, which posits an inverted U-shaped relationship between economic development and certain social indicators. In the context of Alzheimer’s disease prevalence, our findings suggest that as countries transition from low to high income, there is initially an increase in AZ prevalence, followed by a decline as income levels continue to rise.
These results underscore the complex relationship between economic development and health outcomes, highlighting the need for targeted interventions and policies to address the growing burden of Alzheimer’s disease globally. Further research into the underlying mechanisms driving these trends is warranted to inform effective prevention and management strategies.
The Figure 3-3 provides a visual representation of how Alzheimer's disease prevalence varies with economic development across different income groups. Key observations include:
- Low and Low-Middle Income: Generally low AZPVR with minor increases as GDP per capita rises.
- Middle Income: Clearer positive correlation between AZPVR and GDP per capita.
- Middle-Upper and Upper Income: Strong positive correlation, with significant increases in AZPVR observed in wealthier nations.
These trends suggest that as countries develop economically, the prevalence of Alzheimer's disease increases, possibly due to factors such as better diagnostic capabilities, aging populations, and lifestyle changes associated with higher income levels. The data highlight the need for targeted public health strategies to address the rising burden of Alzheimer's disease in the context of economic development.
Figure 3-3 shows the Alzheimer's disease prevalence rate (AZPVR) growth trends across different income groups (low income, lower-middle income, middle income, upper-middle income, and high income) from various countries. The x-axis represents GDP per capita (constant 2017 international dollars), and the y-axis represents the number of Alzheimer's cases per 100,000 people.
- Observations:
- Low-Income Countries: The growth trend is flat with fewer cases.
- Lower-Middle Income Countries: The prevalence rate increases gradually, correlating with economic development.
- Middle-Income Countries: The trend becomes more pronounced with faster growth in the number of cases.
- Upper-Middle Income Countries: There is a significant increase in cases, especially during rapid economic development phases.
- High-Income Countries: The growth trend peaks, and with further GDPPC increases, the growth rate slows down, showing stability or a reduction in the number of cases in some countries.
Figure 3-4 shows the kernel density estimation of Alzheimer's disease prevalence rates across different income groups (low income, lower-middle income, middle income, upper-middle income, and high income). The x-axis represents GDP per capita (constant 2017 international dollars), and the y-axis represents the density of Alzheimer's prevalence.
- Observations:
- Low-Income Group: Highest density of prevalence at lower GDPPC levels.
- Lower-Middle Income Group: Density slightly decreases but remains significant at lower GDPPC levels.
- Middle-Income Group: Peaks at middle GDPPC levels.
- Upper-Middle Income Group: Maintains relatively stable density at higher GDPPC levels.
- High-Income Group: Significantly lower density at the highest GDPPC levels.
Combined Explanation
Fighre 3-3 and 3-4 together illustrate the complex relationship between economic development and Alzheimer's disease prevalence.
- Economic Development and Prevalence: As GDPPC increases, the Alzheimer's prevalence rate rises in low-income and lower-middle-income countries. This could be due to improvements in living conditions and healthcare. However, as GDPPC continues to rise into upper-middle and high-income levels, the growth in prevalence rates slows or even declines, possibly due to better prevention and treatment measures in high-income countries.
- Distribution Patterns: The prevalence rate distribution across different income groups shows an inverted U-shape, similar to the Kuznets curve. In low-income levels, prevalence density is high; as income levels increase, prevalence density decreases, especially in high-income groups where the density significantly drops.
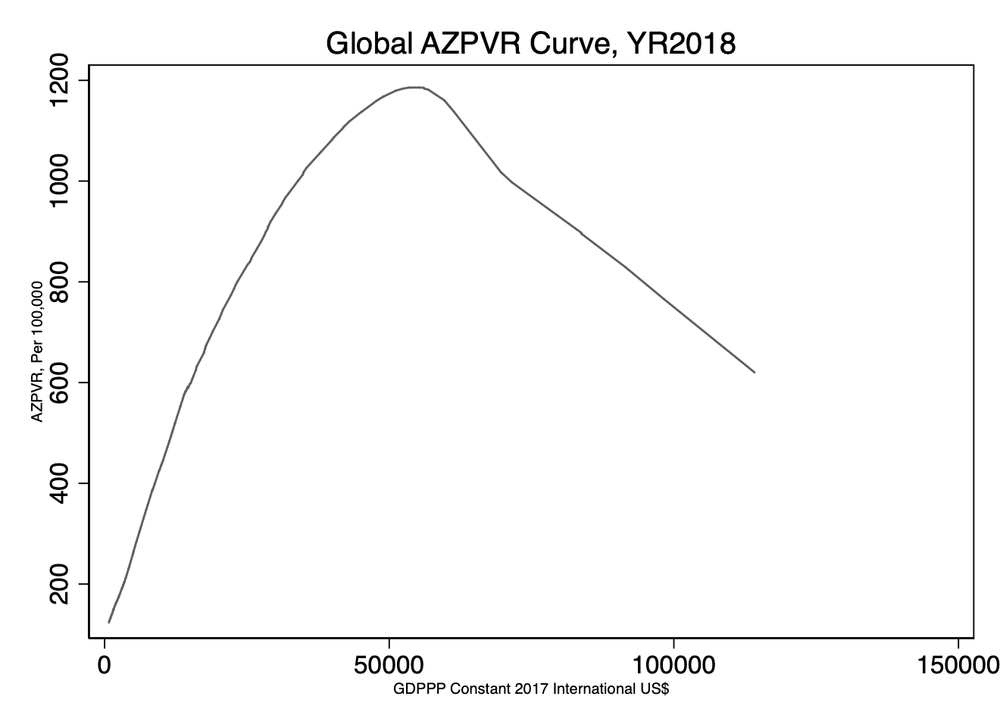
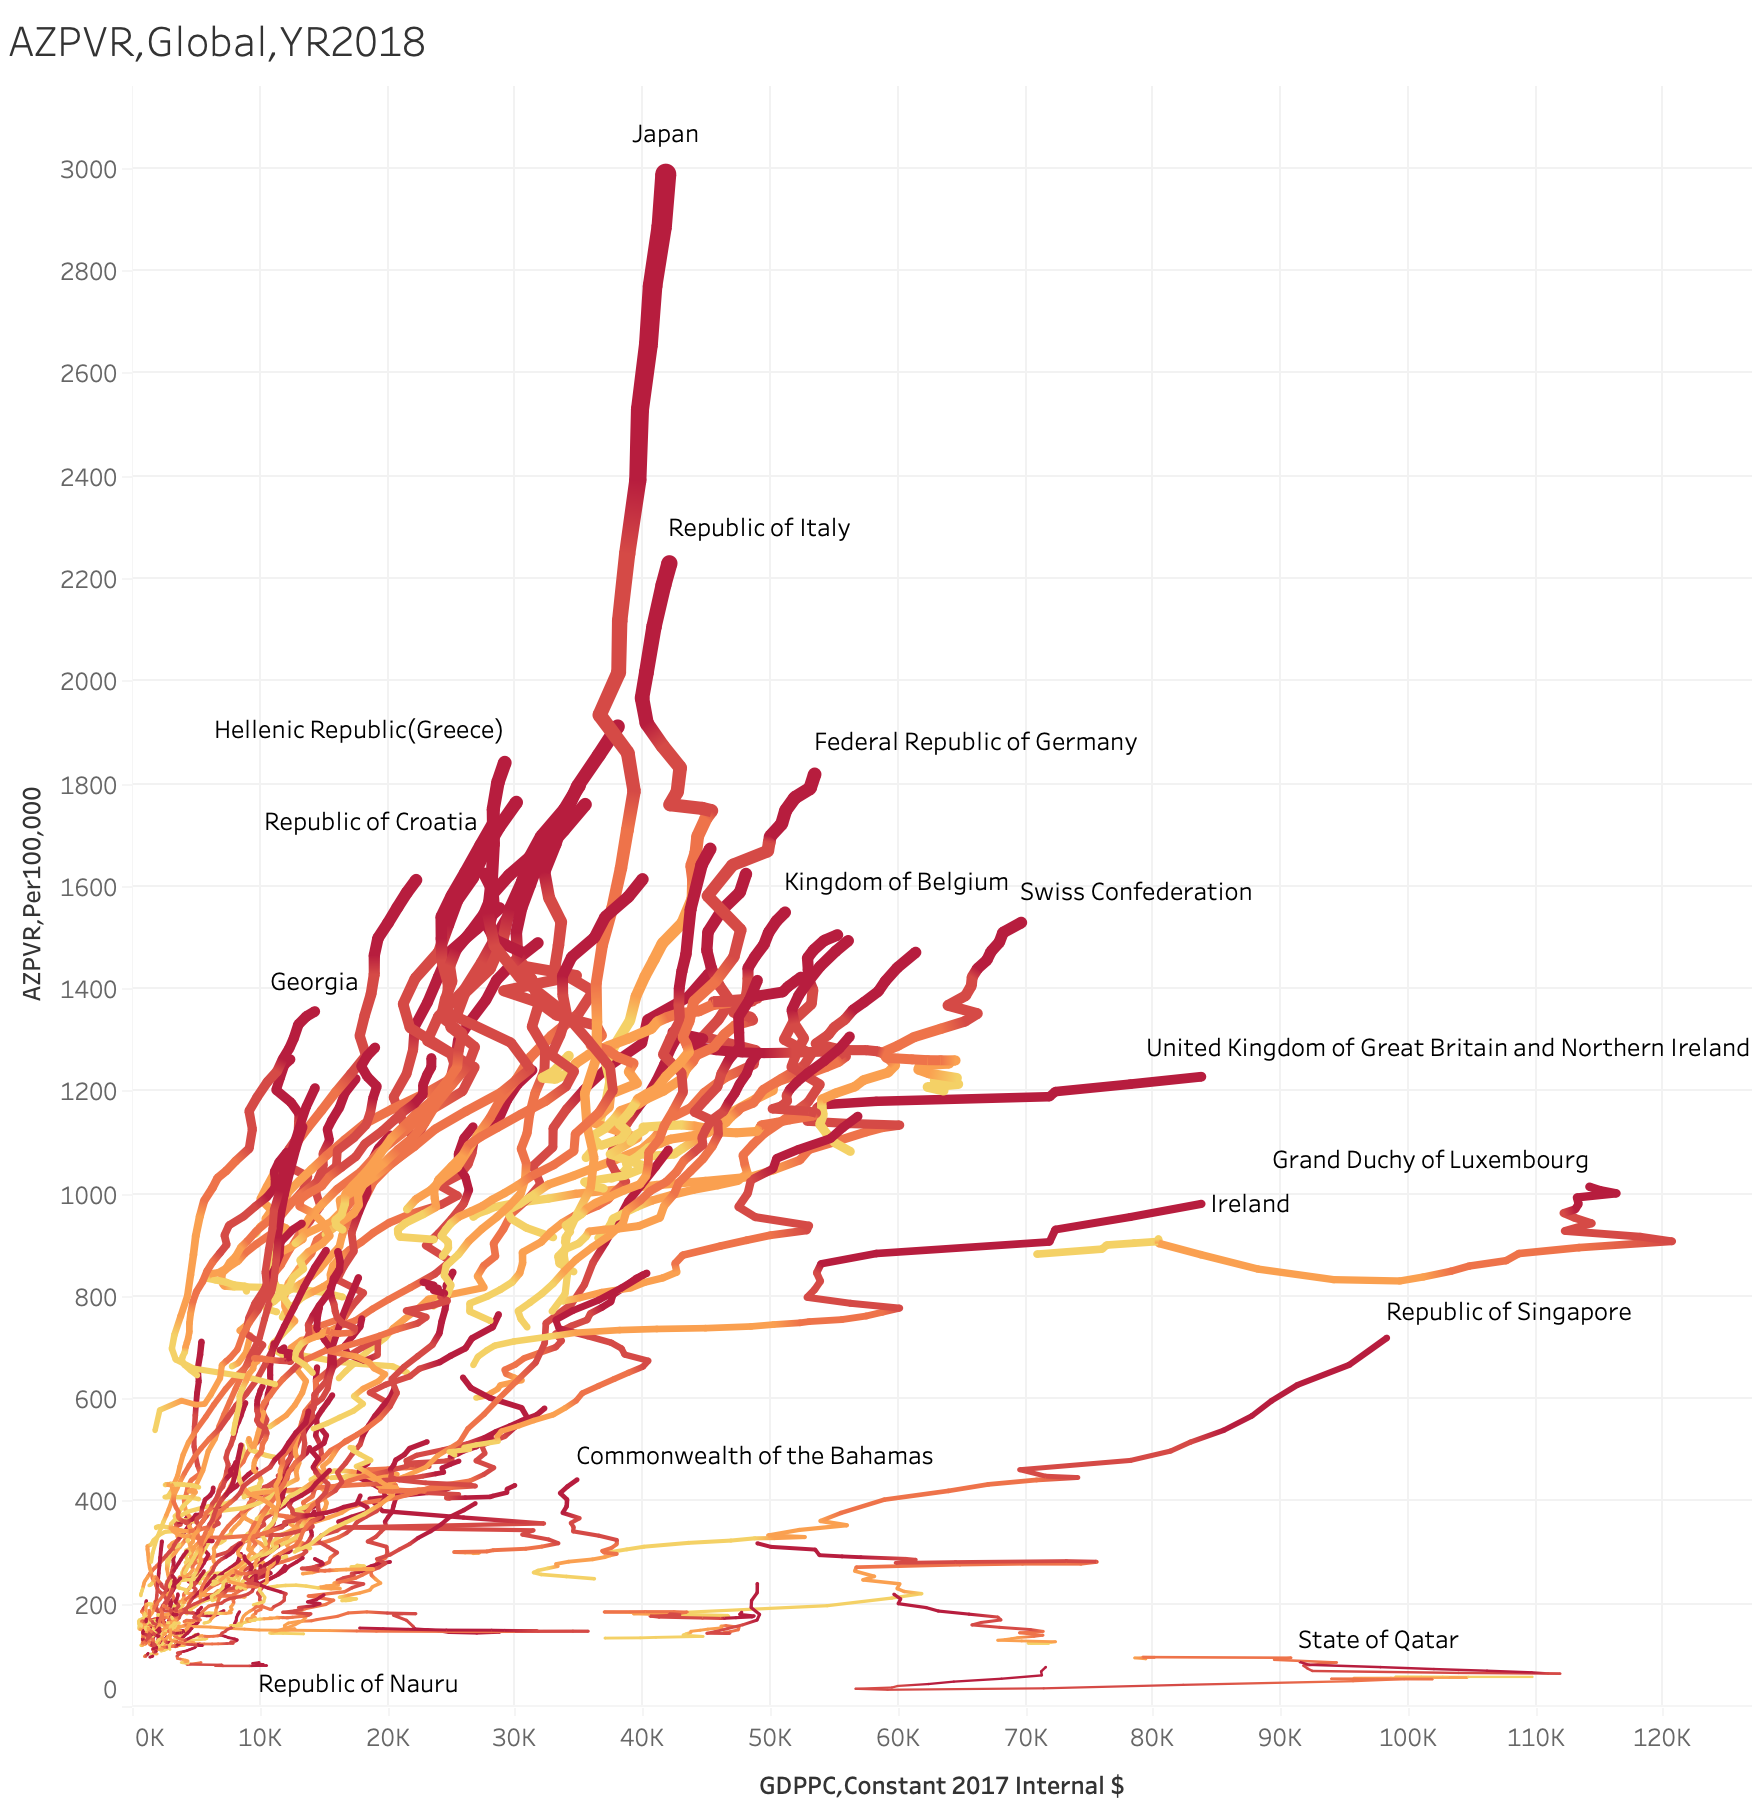
Figure 3-1 Global AZPVR Curve Figure 3-2 AZPVR of Countries trend
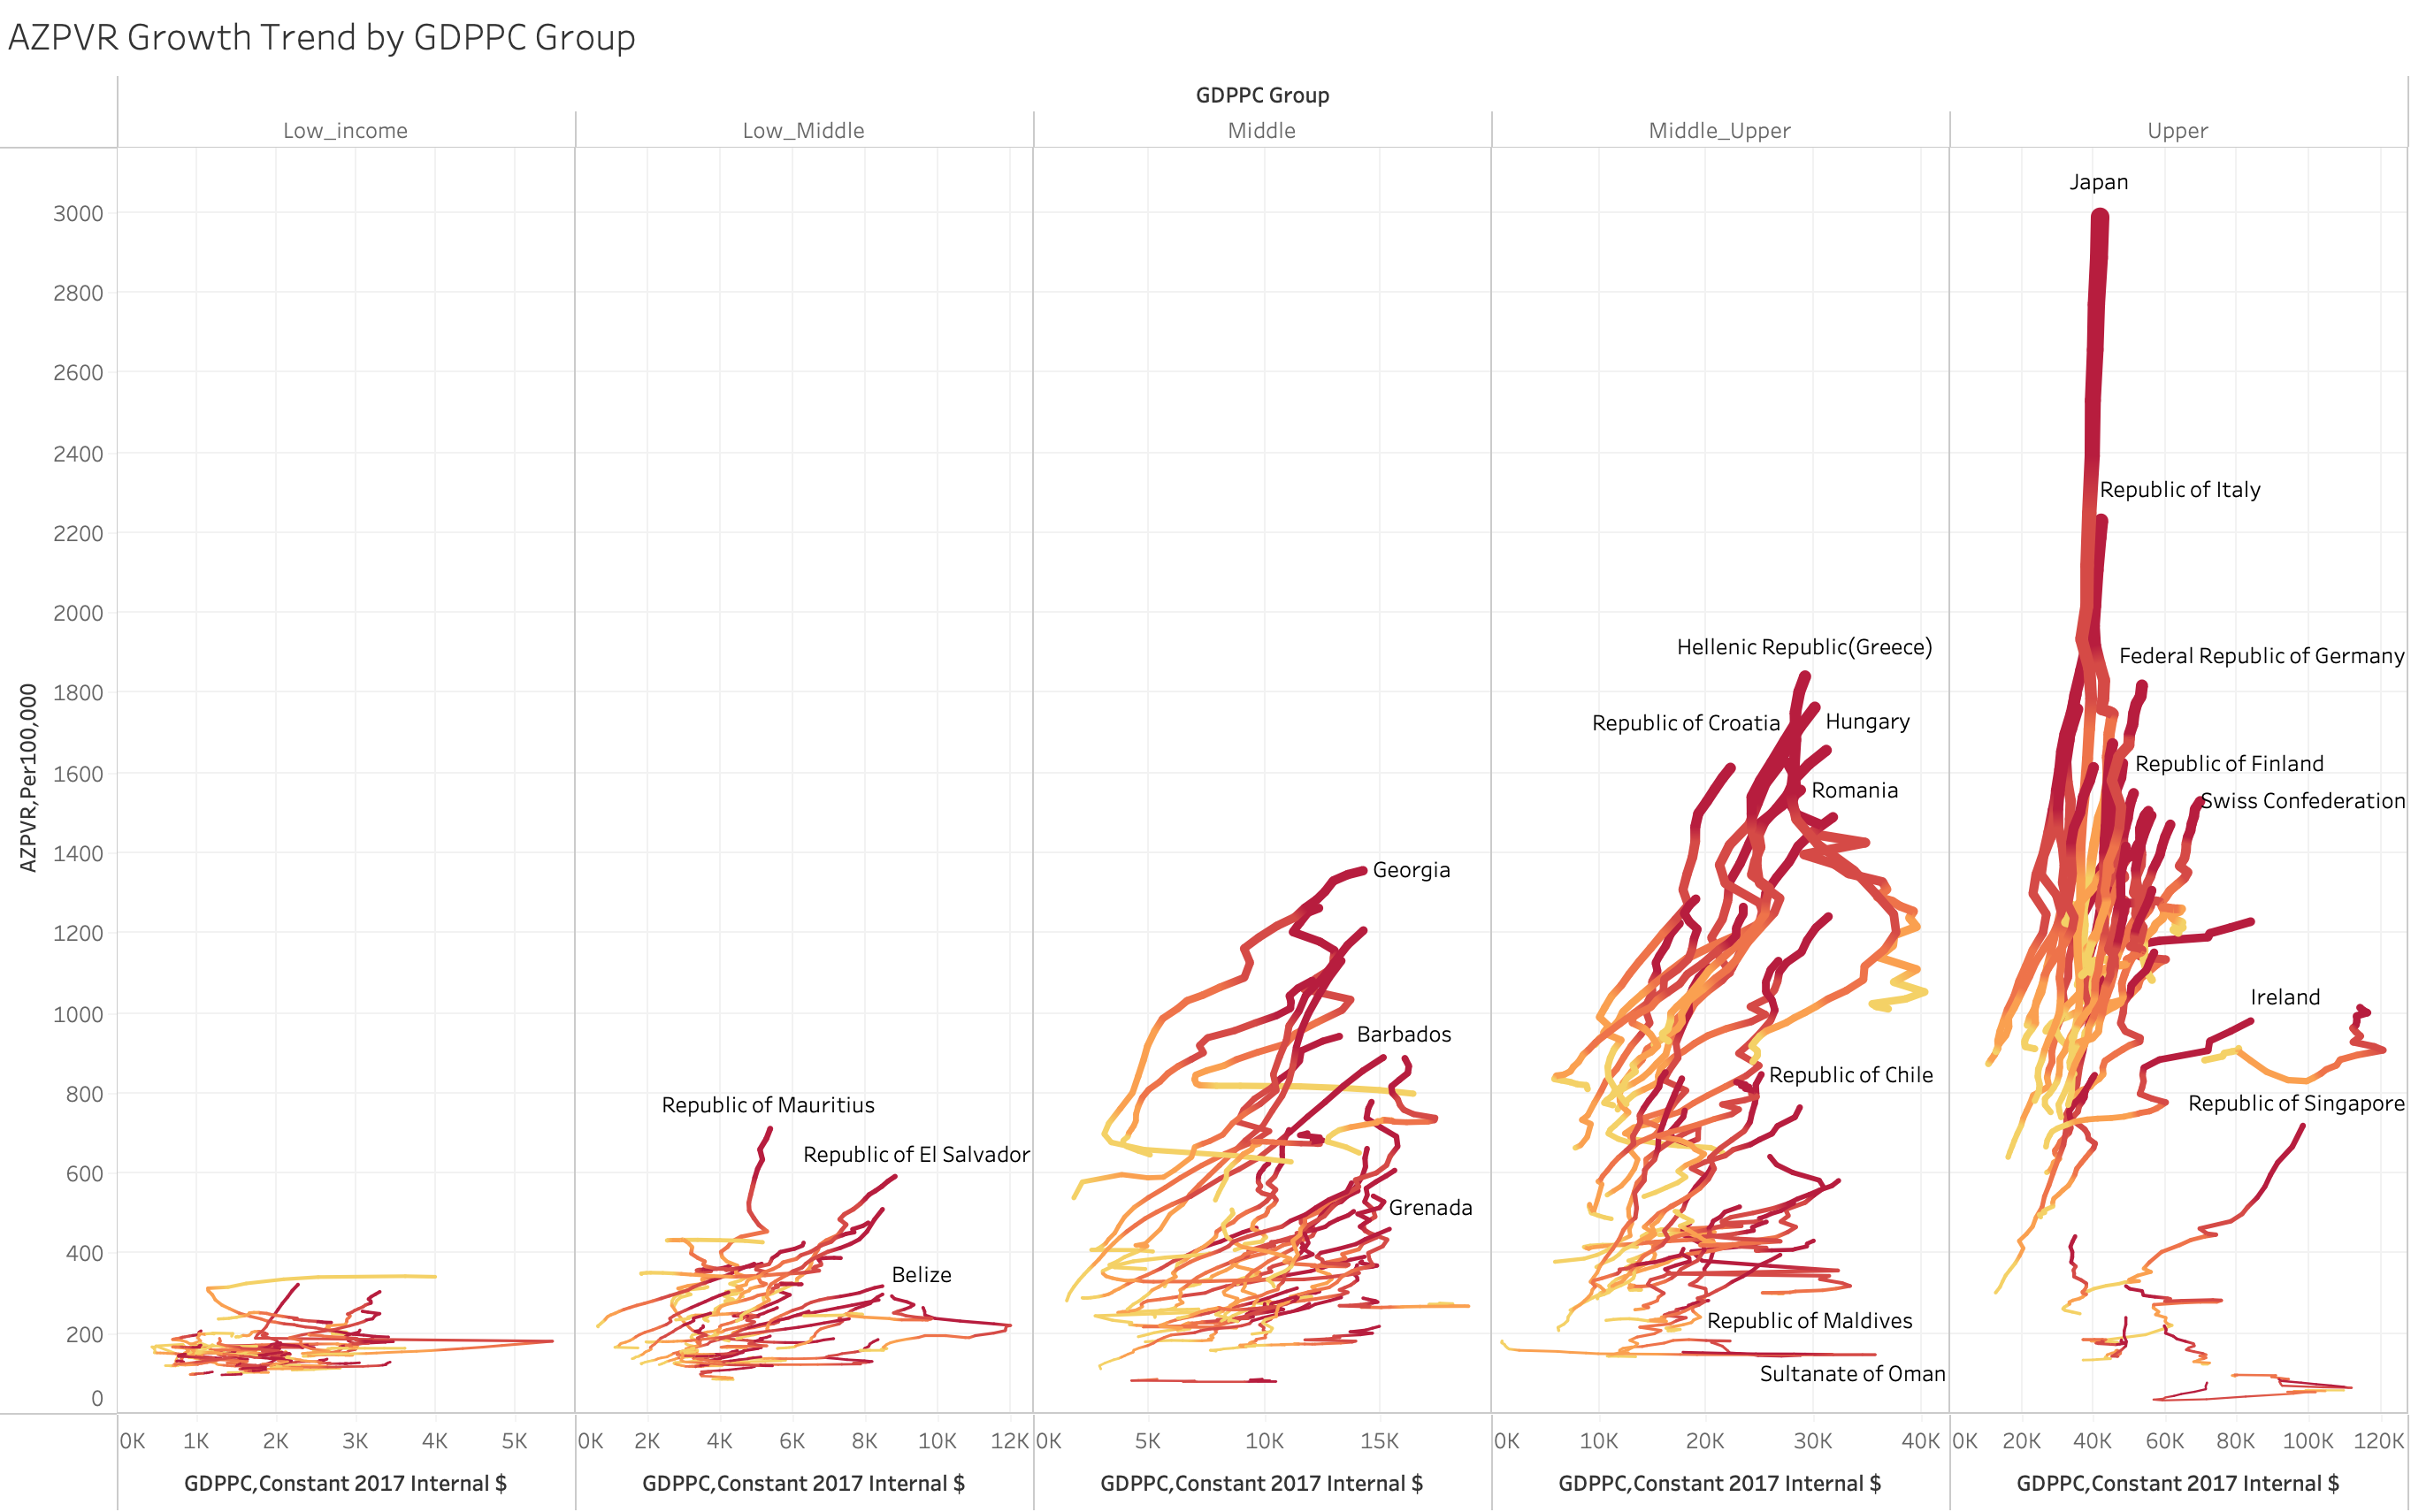
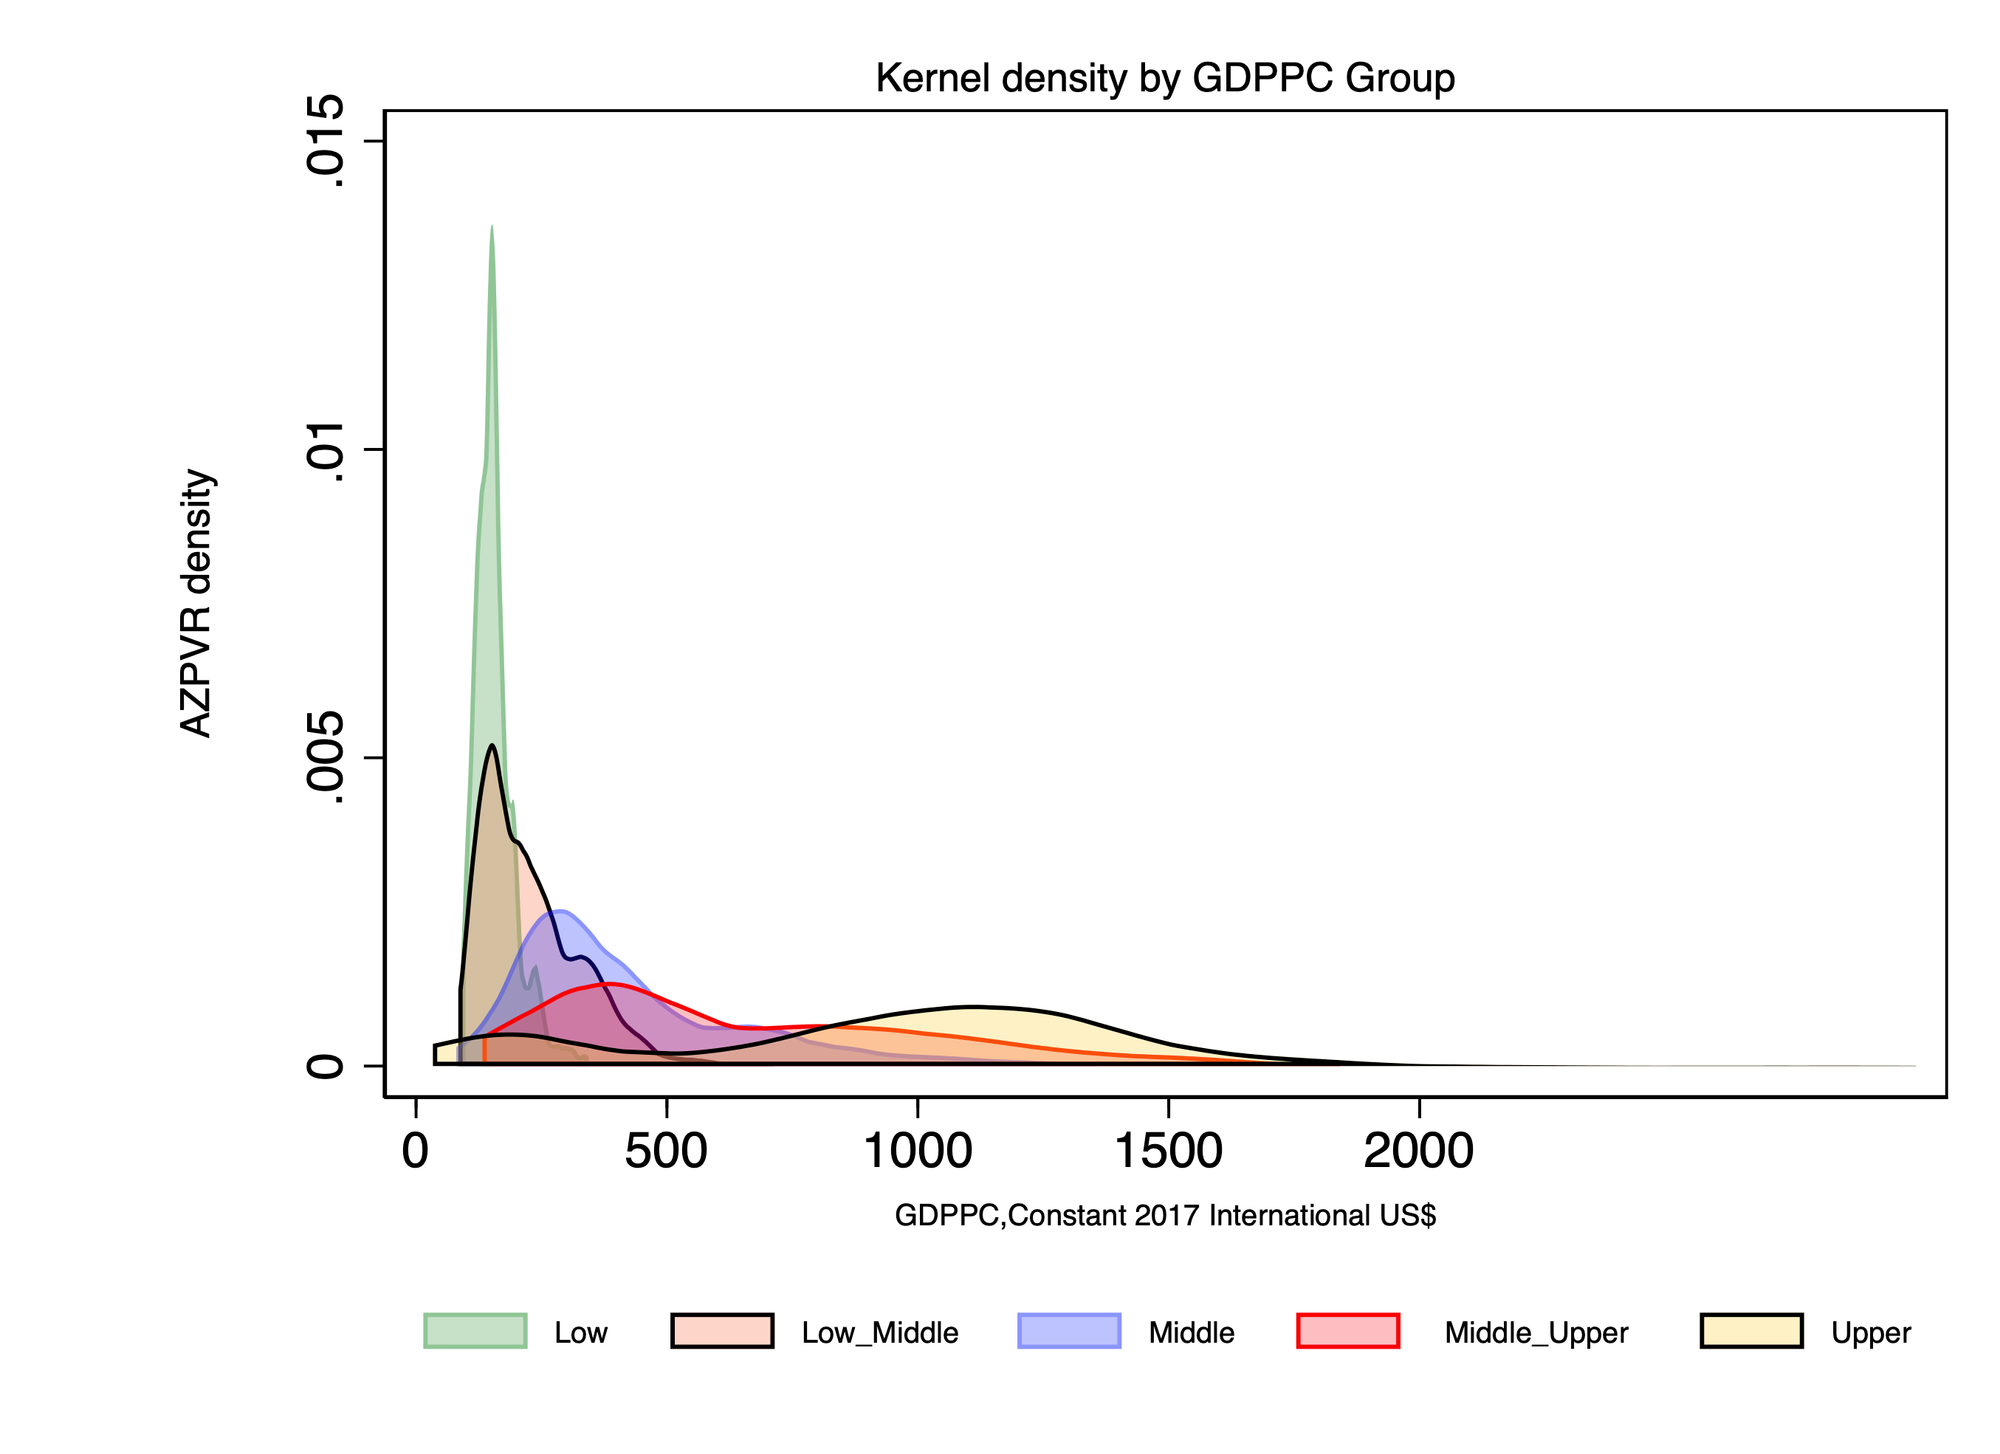
Figure 3-3 AZPVR Growth Trend by GDPPC and Countries Figure 3-4. AZPVR Density by GDPPC Group
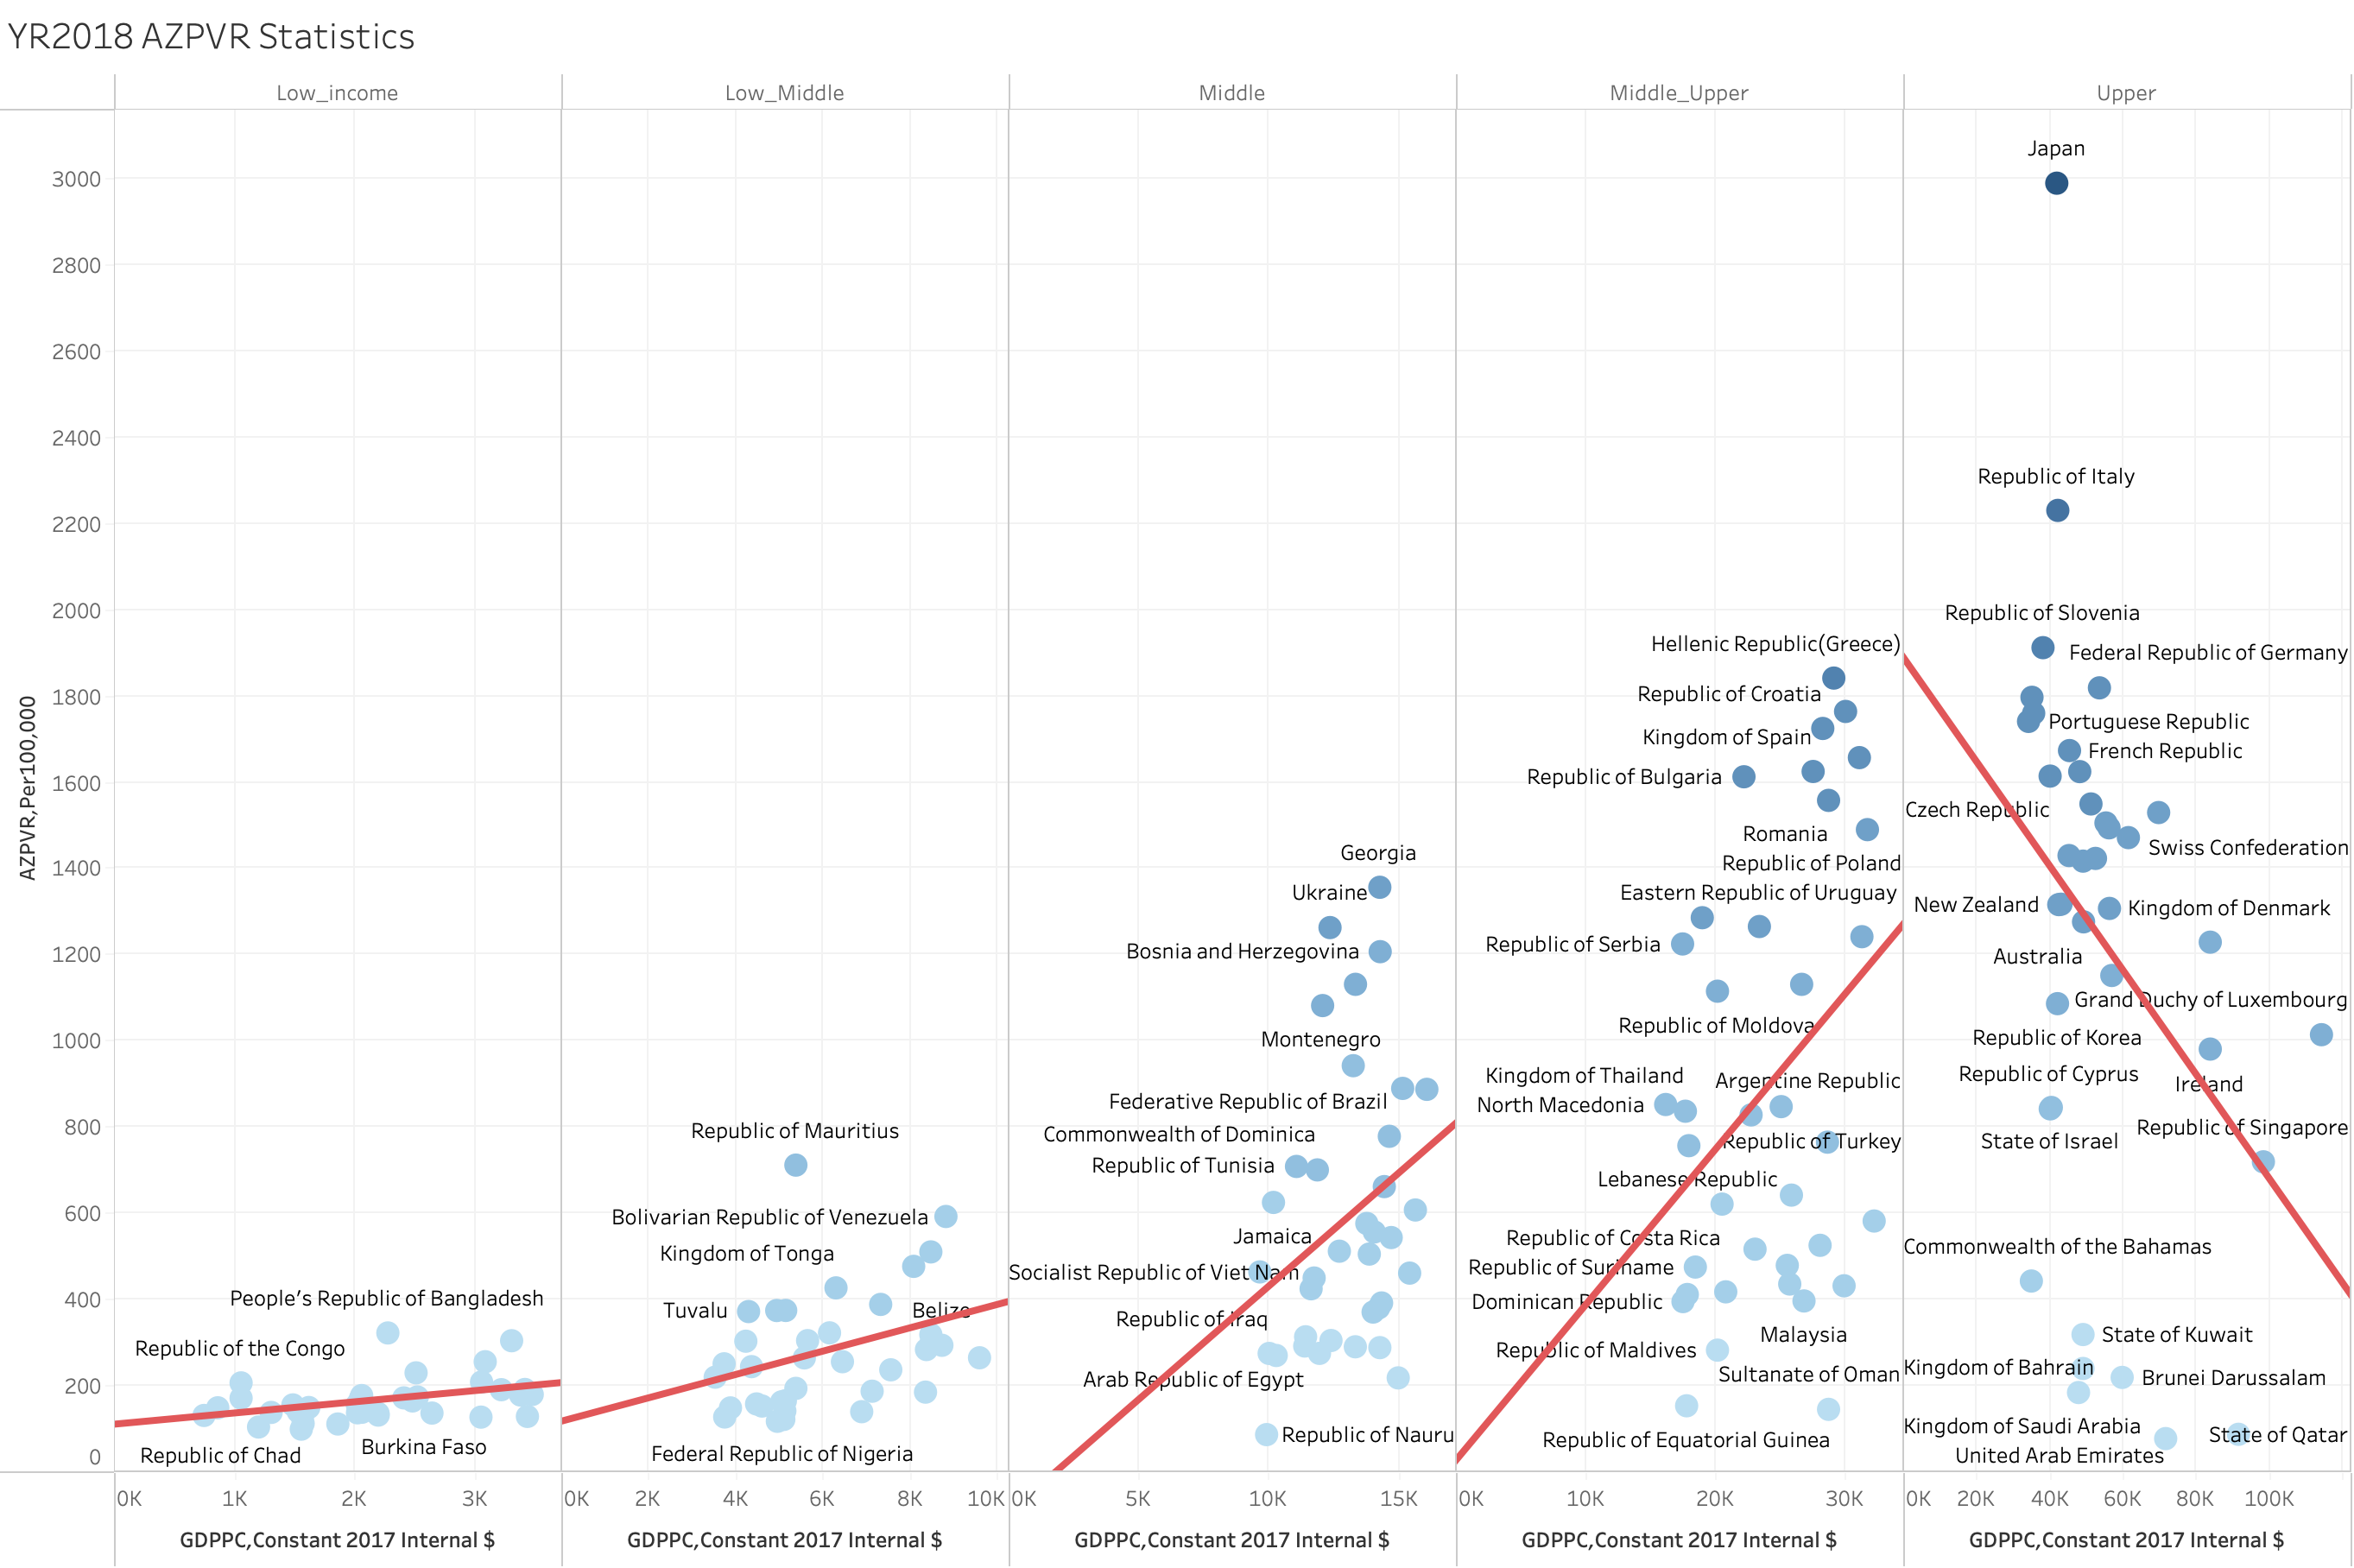
Figure 3-5 illustrates the relationship between the prevalence rate of Alzheimer's disease (per 100,000 people) and Gross Domestic Product per capita (GDP per capita, measured in 2017 international dollars) for 183 countries in 2018. The regression line indicates the trend of Alzheimer's disease prevalence as it correlates with economic development.
Key details from the figure are as follows:
- Horizontal Axis (X-axis): This axis represents the GDPPC in 2017 international dollars. Different income groups are marked on the axis: low-income, lower-middle-income, middle-income, upper-middle-income, and high-income countries.
- Vertical Axis (Y-axis): This axis indicates the prevalence rate of Alzheimer's disease per 100,000 people.
- Scatter Plot: Each blue dot represents a country, with its position reflecting the corresponding GDPPC and Alzheimer's disease prevalence rate.
- Regression Line: This line shows the trend of Alzheimer's disease prevalence across different income levels.
The figure reveals several trends:
- In low-income and lower-middle-income countries, as GDPPC increases, the prevalence of Alzheimer's disease also rises.
- This increasing trend continues in middle-income and upper-middle-income countries.
- However, once countries reach the high-income group, further increases in GDPPC are associated with a decline in Alzheimer's disease prevalence.
The analysis demonstrates a Kuznets curve relationship between Alzheimer's disease prevalence and economic development: during the early stages of economic growth, prevalence rates increase with rising income; in the later stages, prevalence rates decrease as income continues to grow.
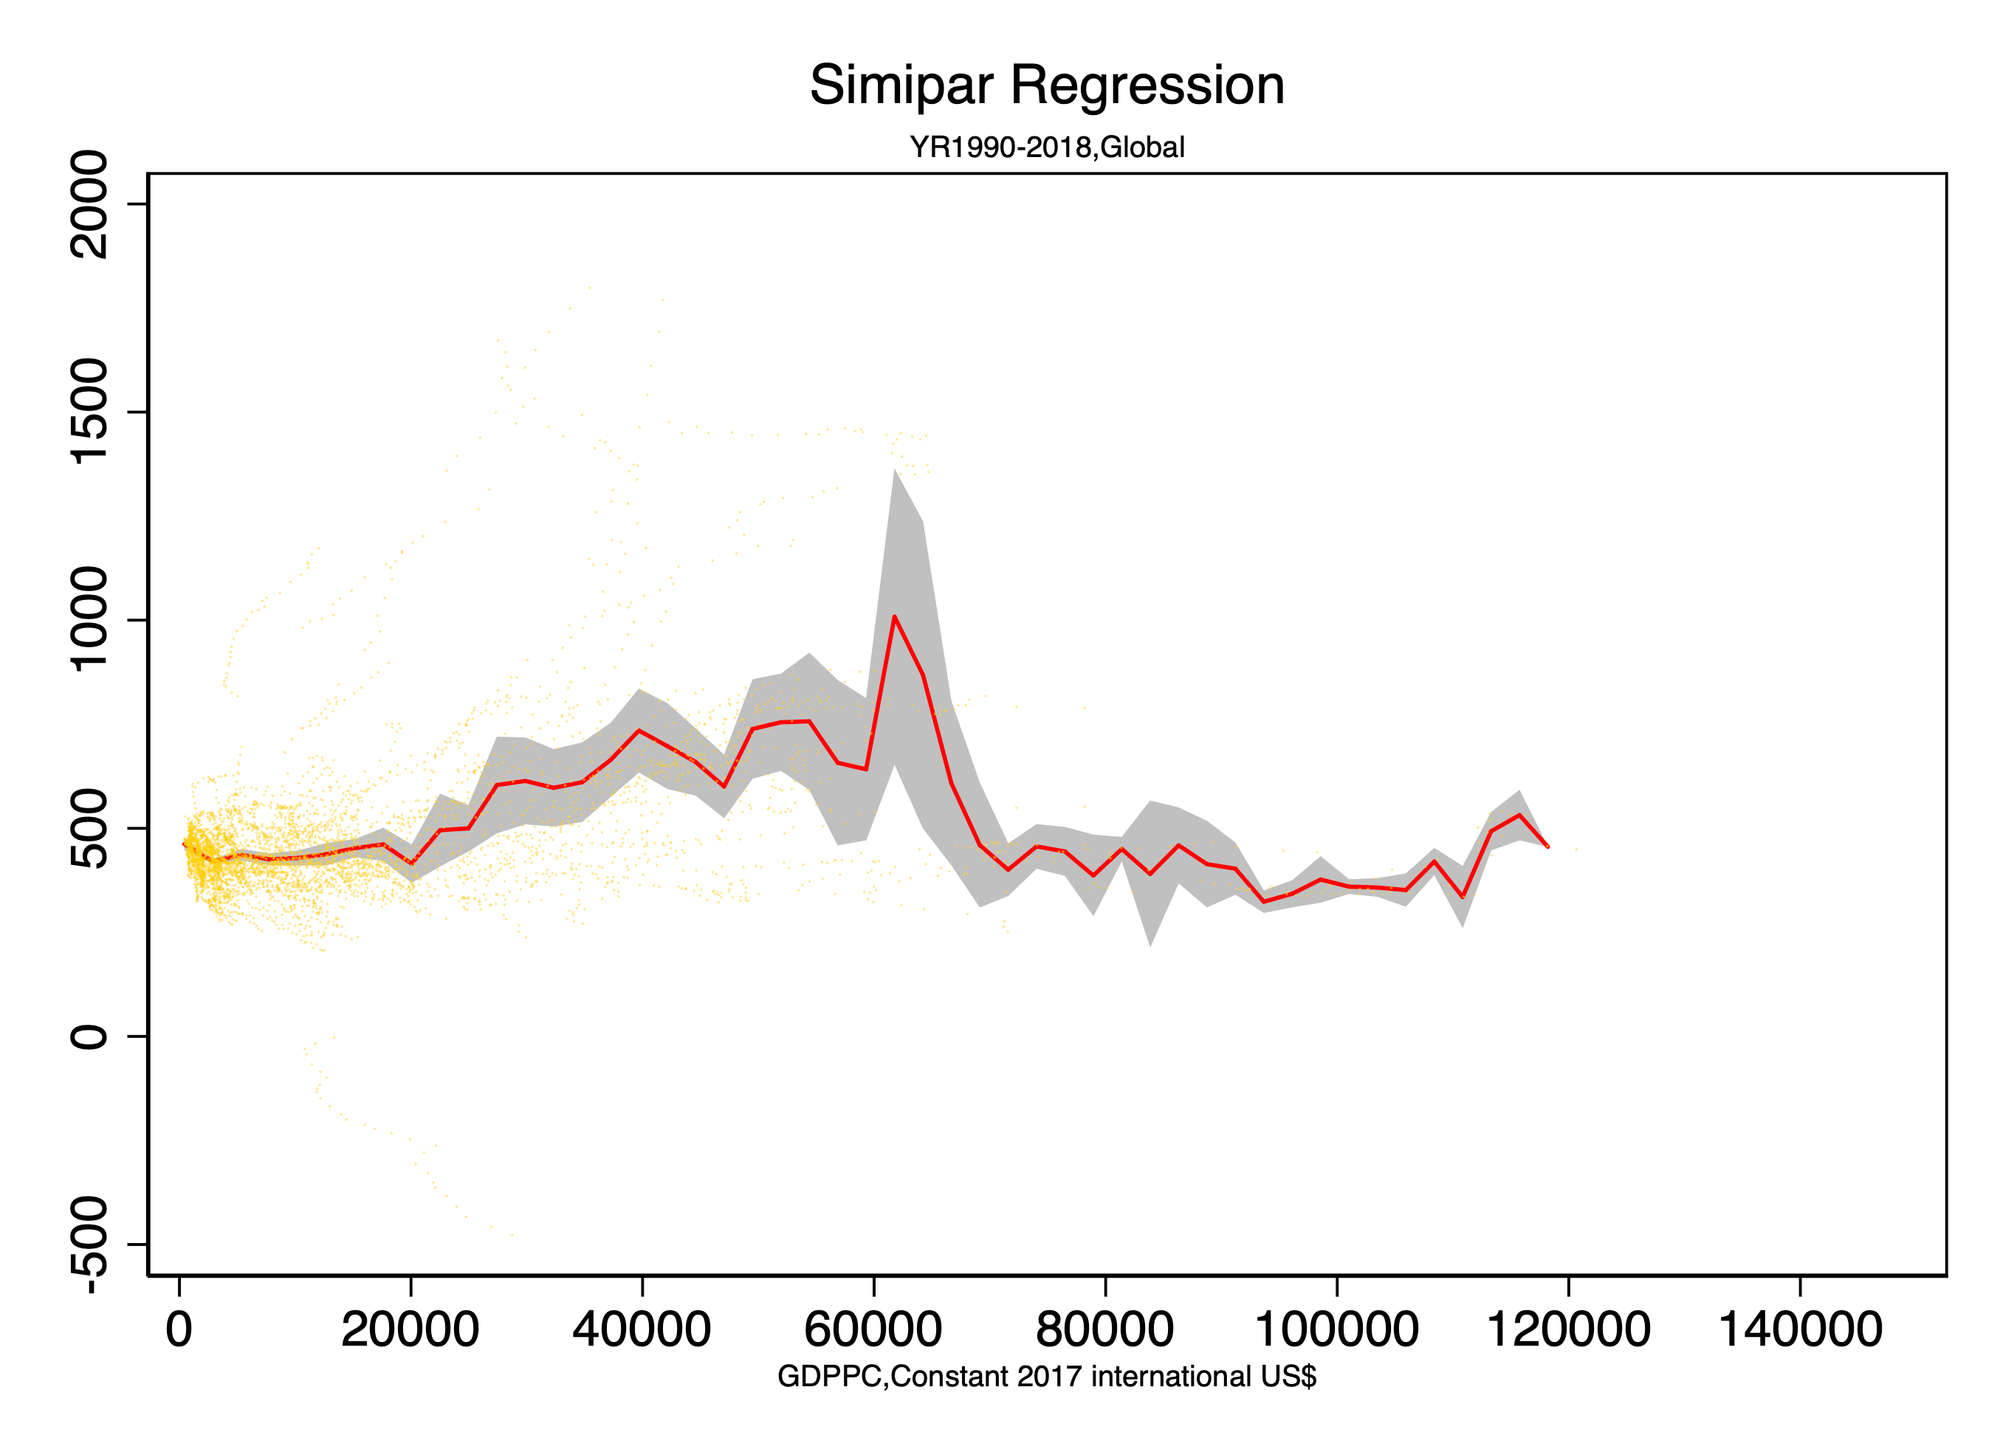
The semiparametric analysis.
As Figure 3-6.The graph you uploaded illustrates the semiparametric regression analysis, depicting the relationship between GDP per capita (GDPPC) and Alzheimer's disease prevalence from 1990 to 2018 globally.
Early Stages (Lower GDPPC Levels)
- Description: At lower levels of GDPPC (left side of the graph), the prevalence of Alzheimer's disease increases slowly as GDPPC increases.
- Explanation: In the early stages of economic development, improvements in living conditions and longer life spans contribute to a gradual increase in disease rates.
Intermediate Stage (Intermediate GDPPC Levels)
Description: At intermediate GDPPC levels (middle part of the graph), the prevalence continues to increase and reaches a peak.
- Explanation: During rapid economic development, medical conditions and diagnostic capabilities improve, leading to more cases being discovered and reported.
Later Stages (Higher GDPPC Levels)
- Description: At higher GDPPC levels (right side of the graph), the prevalence begins to decrease.
- Explanation: High-income countries may have made progress in preventing and treating Alzheimer's disease. Additionally, other health and social factors in high-income countries may reduce the impact of income levels on disease prevalence.
Kuznets Curve
- Description: The graph shows a non-linear relationship between Alzheimer's disease prevalence and economic development, forming an inverted U-shape similar to a Kuznets curve.
- Implications:
- Early and Middle Stages: Prevalence increases with income.
- Later Stages: Prevalence declines as income further increases.
- Significance: This indicates a complex, multidimensional impact of economic development on health status, requiring tailored public health strategies at different stages of development to address Alzheimer's disease effectively.
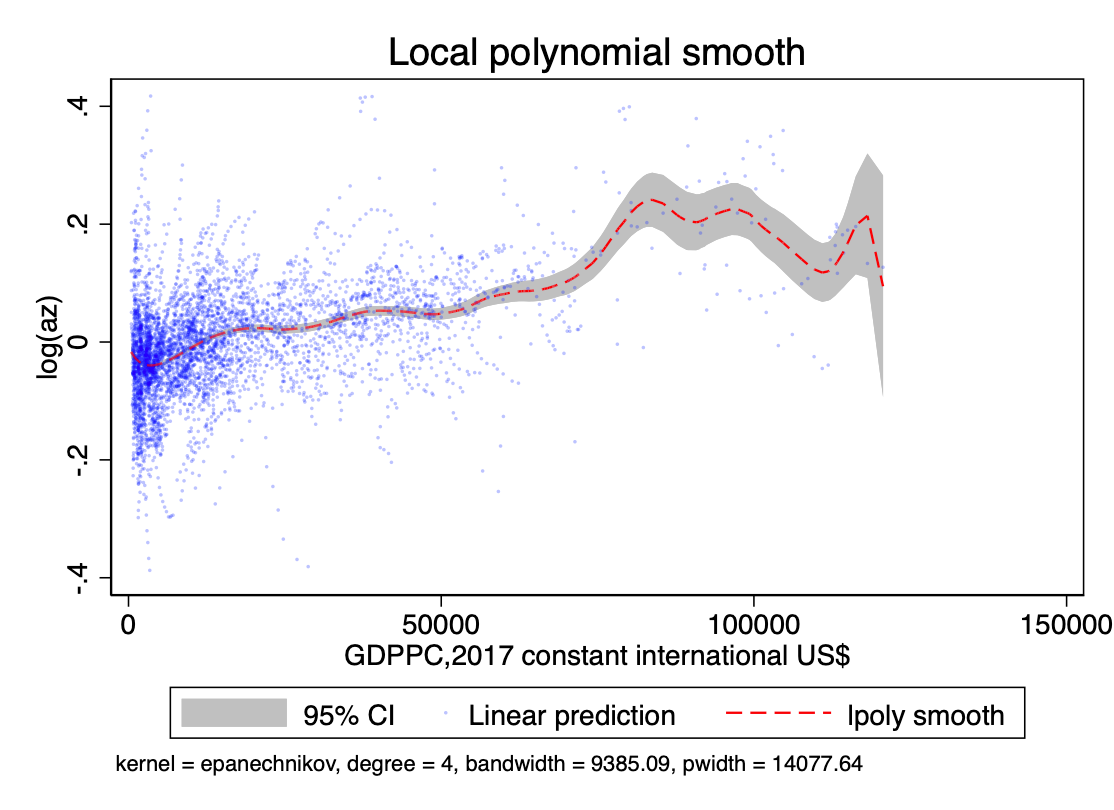
The xtsemiparametric analysis.
Figure 3-7 presents the results of the Local Polynomial Smooth analysis, depicting the relationship between GDP per capita (GDPPC) and Alzheimer's disease prevalence globally in 2018.
Early Stages (Lower GDPPC Levels)
- Description: At lower levels of GDPPC (left side of the graph), the prevalence of Alzheimer's disease increases slowly as GDPPC increases.
- Explanation: In the early stages of economic development, improvements in living conditions and longer life spans contribute to a gradual increase in disease rates.
Intermediate Stage (Intermediate GDPPC Levels)
- Description: At intermediate GDPPC levels (middle part of the graph), the prevalence continues to increase and reaches a peak.
- Explanation: During rapid economic development, medical conditions and diagnostic capabilities improve, leading to more cases being discovered and reported.
Later Stages (Higher GDPPC Levels)
- Description: At higher GDPPC levels (right side of the graph), the prevalence begins to decrease.
- Explanation: High-income countries may have made progress in preventing and treating Alzheimer's disease. Additionally, other health and social factors in high-income countries may reduce the impact of income levels on disease prevalence.
Kuznets Curve
- Description: The graph shows a non-linear relationship between Alzheimer's disease prevalence and economic development, forming an inverted U-shape similar to a Kuznets curve.
- Implications:
- Early and Intermediate Stages: Prevalence increases with income.
- Later Stages: Prevalence declines as income further increases.
This analysis illustrates the complex relationship between economic development and health status, indicating the need for different measures to address public health challenges at various stages of economic development.
4. Discussion: Explain the Alzheimer Kuzents Curve
Finding the Kuznets Curve in OECD CountriesThe graphs in Figures 4-1 and 4-2 illustrate the relationship between Gross Domestic Product per capita (GDPPC) and the prevalence rate of Alzheimer's disease (AZPVR) in OECD countries for the year 2018. These visualizations suggest the presence of a Kuznets curve, a concept traditionally used to describe the relationship between income inequality and economic development, which can be extended to other socio-economic phenomena.
Aggregate AZPVR Curve
Figure 4-1 shows an aggregated curve for all OECD countries, plotting the AZPVR per 100,000 people against GDPPC. The curve depicts an inverted U-shape, indicating that at lower levels of GDP per capita, the prevalence rate of Alzheimer's disease increases with economic development. However, after reaching a certain threshold of economic prosperity, further increases in GDP per capita are associated with a decline in the prevalence rate of Alzheimer's disease.
Country-Specific AZPVR Trends
Figure 4-2 provides a more detailed view by displaying the AZPVR-GDPPC relationship for individual OECD countries. Each country's trajectory reinforces the overall pattern observed in Figure 4-1, with variations reflecting specific national contexts. For example, countries like Japan and Italy show a steeper rise in Alzheimer's prevalence at lower GDP levels, followed by a sharp decline as economic development progresses. In contrast, countries with more moderate increases in GDP per capita, such as Poland and Turkey, show a more gradual inverted U-shape.
Interpretation
These findings align with the hypothesis of a Kuznets curve in the context of Alzheimer's disease prevalence and economic development. The initial increase in Alzheimer's prevalence with rising GDP per capita could be attributed to better diagnostic capabilities, higher awareness, and improved reporting in wealthier economies. As countries continue to develop economically, factors such as improved healthcare infrastructure, better preventive measures, and enhanced living conditions contribute to the subsequent decline in Alzheimer's prevalence rates.
Implications
Understanding this Kuznets-like relationship has significant implications for public health policy and economic planning. Policymakers in developing OECD countries should anticipate and plan for an initial rise in Alzheimer's cases as their economies grow, while also investing in healthcare improvements to mitigate this trend. Conversely, developed countries should focus on sustaining their healthcare advancements to maintain or further reduce the prevalence of Alzheimer's disease.the observed Kuznets curve in Alzheimer's disease prevalence among OECD countries underscores the complex interplay between economic development and public health outcomes, highlighting the need for tailored policy interventions at different stages of economic growth.
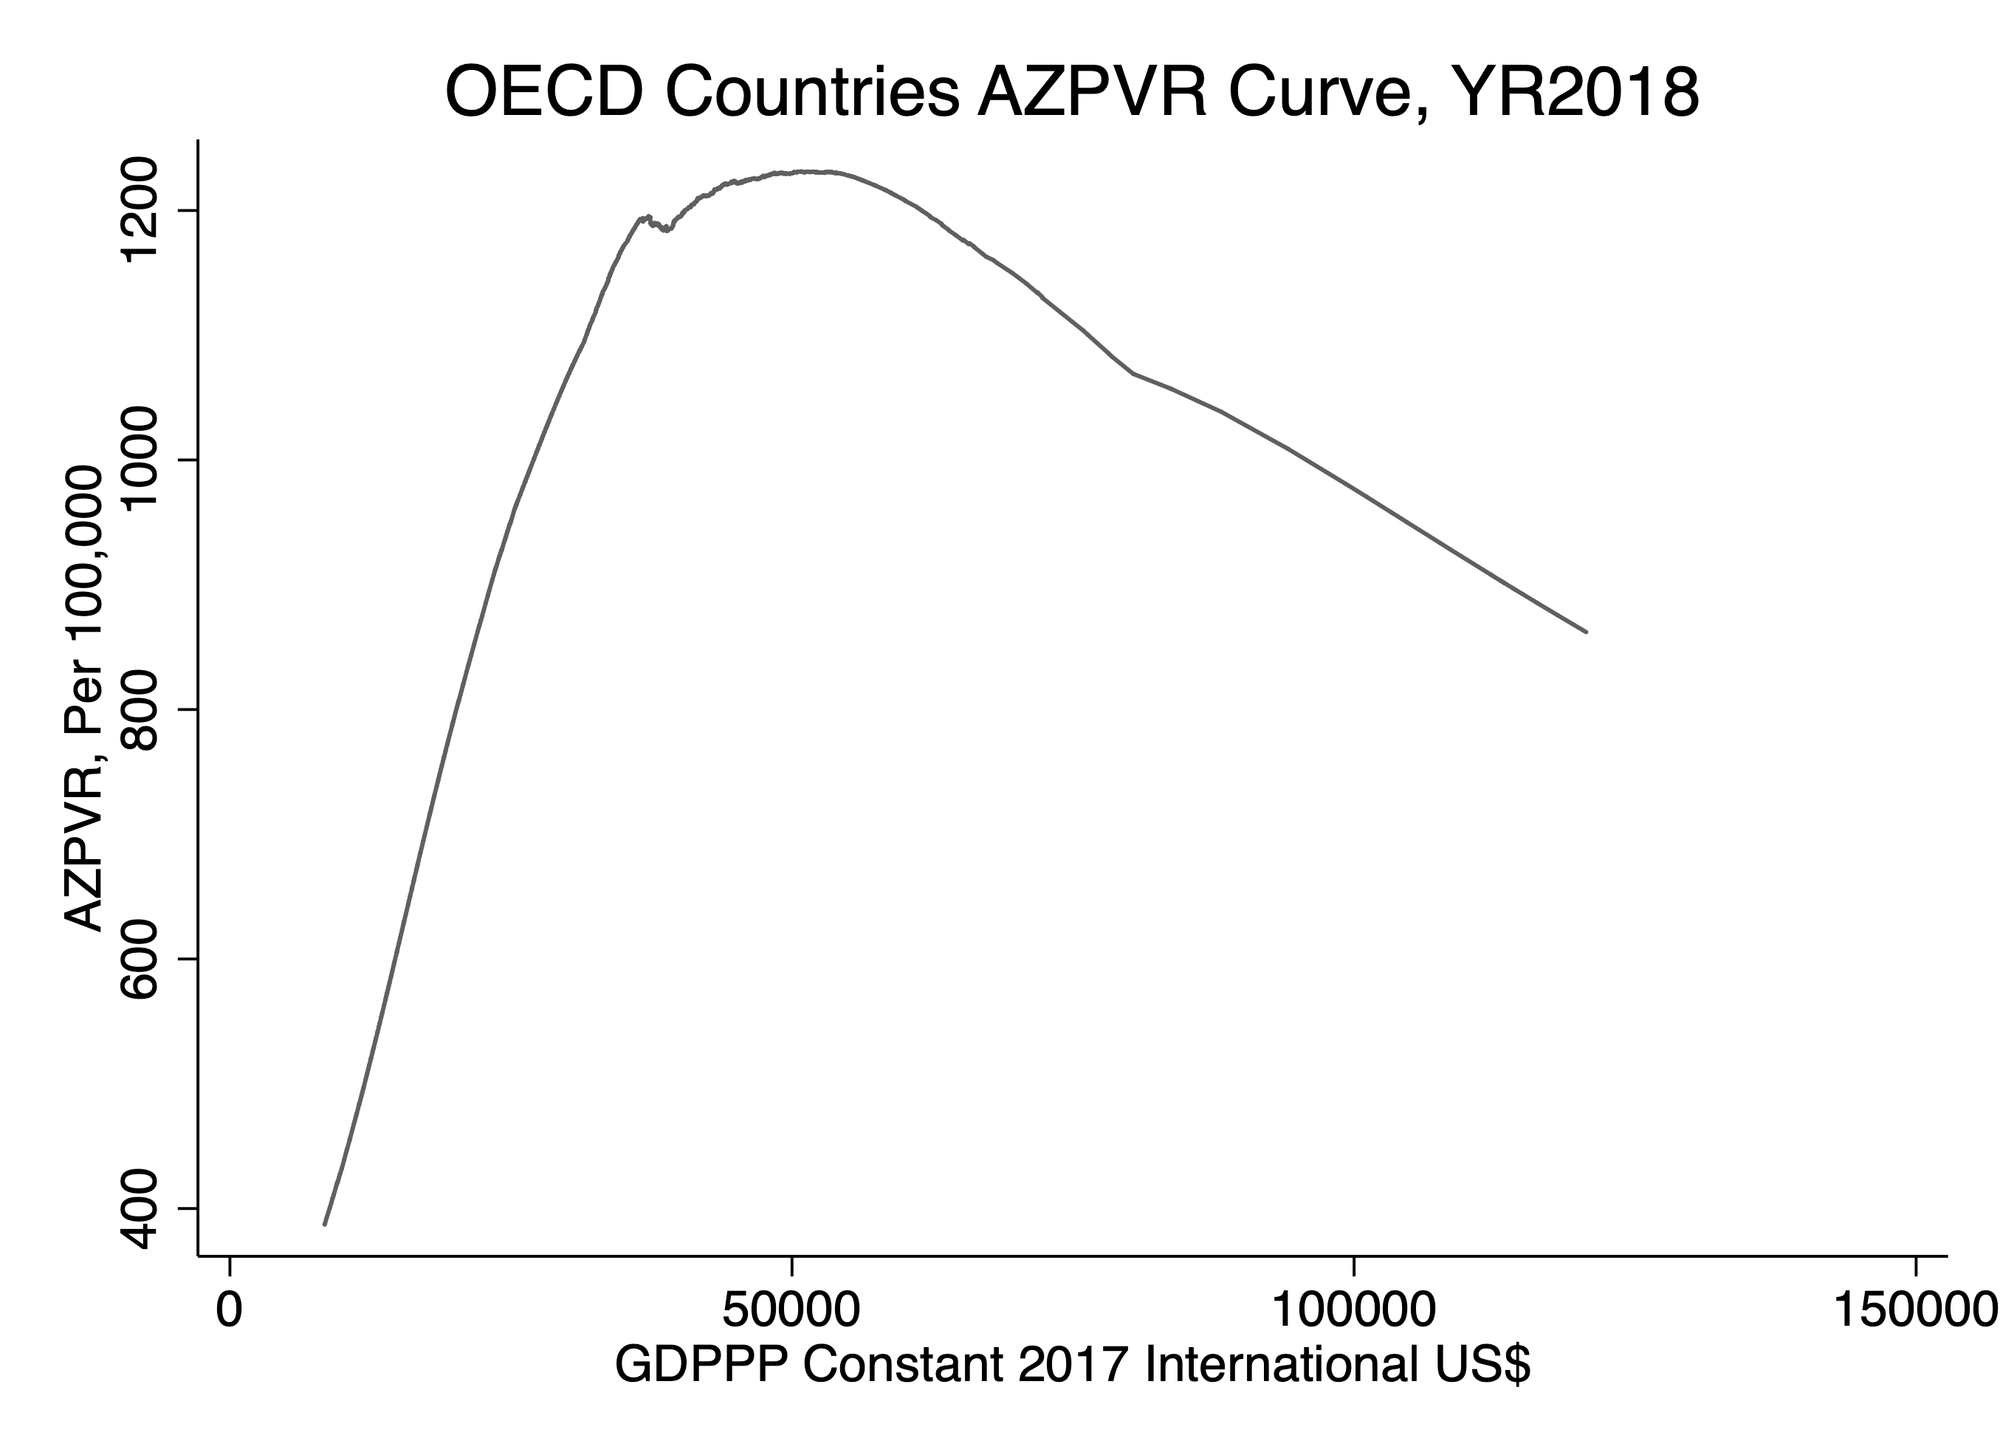
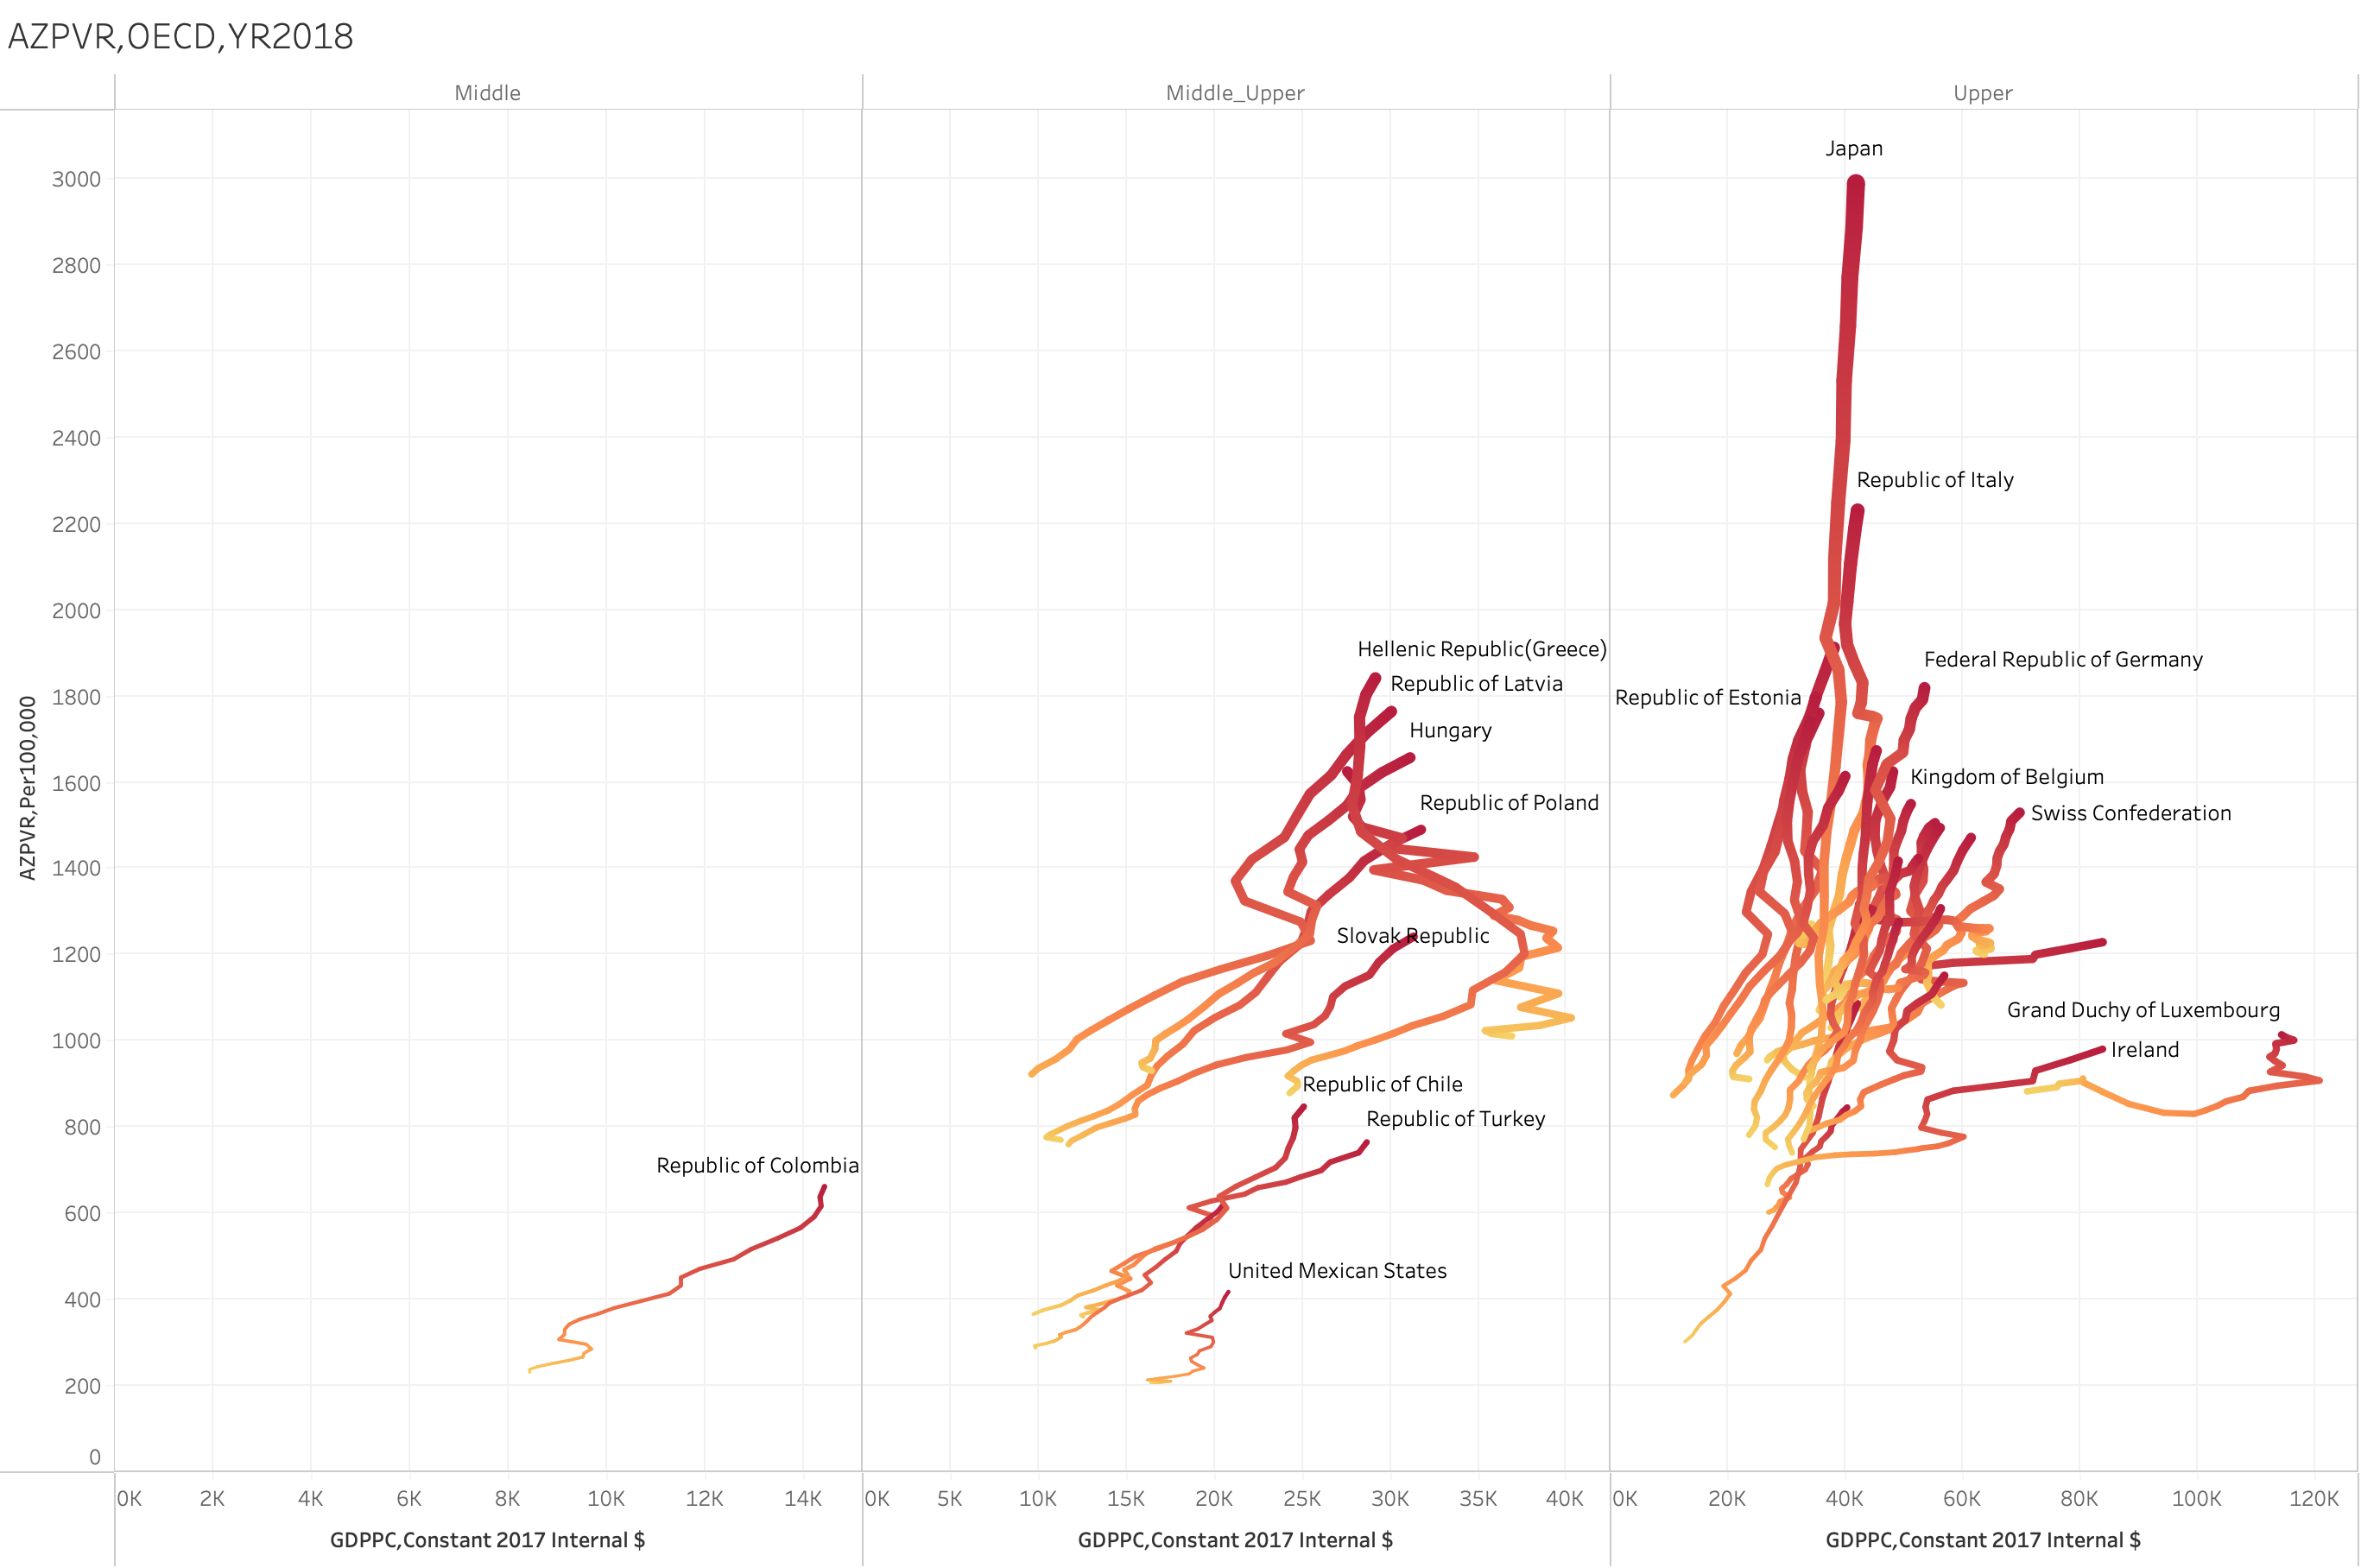
Figure 4-1 OECD Countries AZPVR Curve Figure.4.2 AZPVR Statistic by GDP group
The Relationship Between AZPVR and Non-HDL Cholesterol
The graphs in Figures 4-3 and 4-4 illustrate the relationship between the prevalence rate of Alzheimer's disease (AZPVR) and non-HDL cholesterol levels in 2018. These visualizations help us understand how non-HDL cholesterol, a key cardiovascular risk factor, correlates with the prevalence of Alzheimer's disease across different countries.Aggregate AZPVR vs. Non-HDL Cholesterol Curve.Figure 4-3 shows an aggregated curve depicting AZPVR per 100,000 people against non-HDL cholesterol levels (mg/dL). The curve demonstrates a clear positive relationship, where higher non-HDL cholesterol levels are associated with higher prevalence rates of Alzheimer's disease. This trend suggests that as non-HDL cholesterol increases, so does the risk or prevalence of Alzheimer's disease, indicating the potential impact of cardiovascular health on neurological conditions.Country-Specific AZPVR vs. Non-HDL Cholesterol Trends
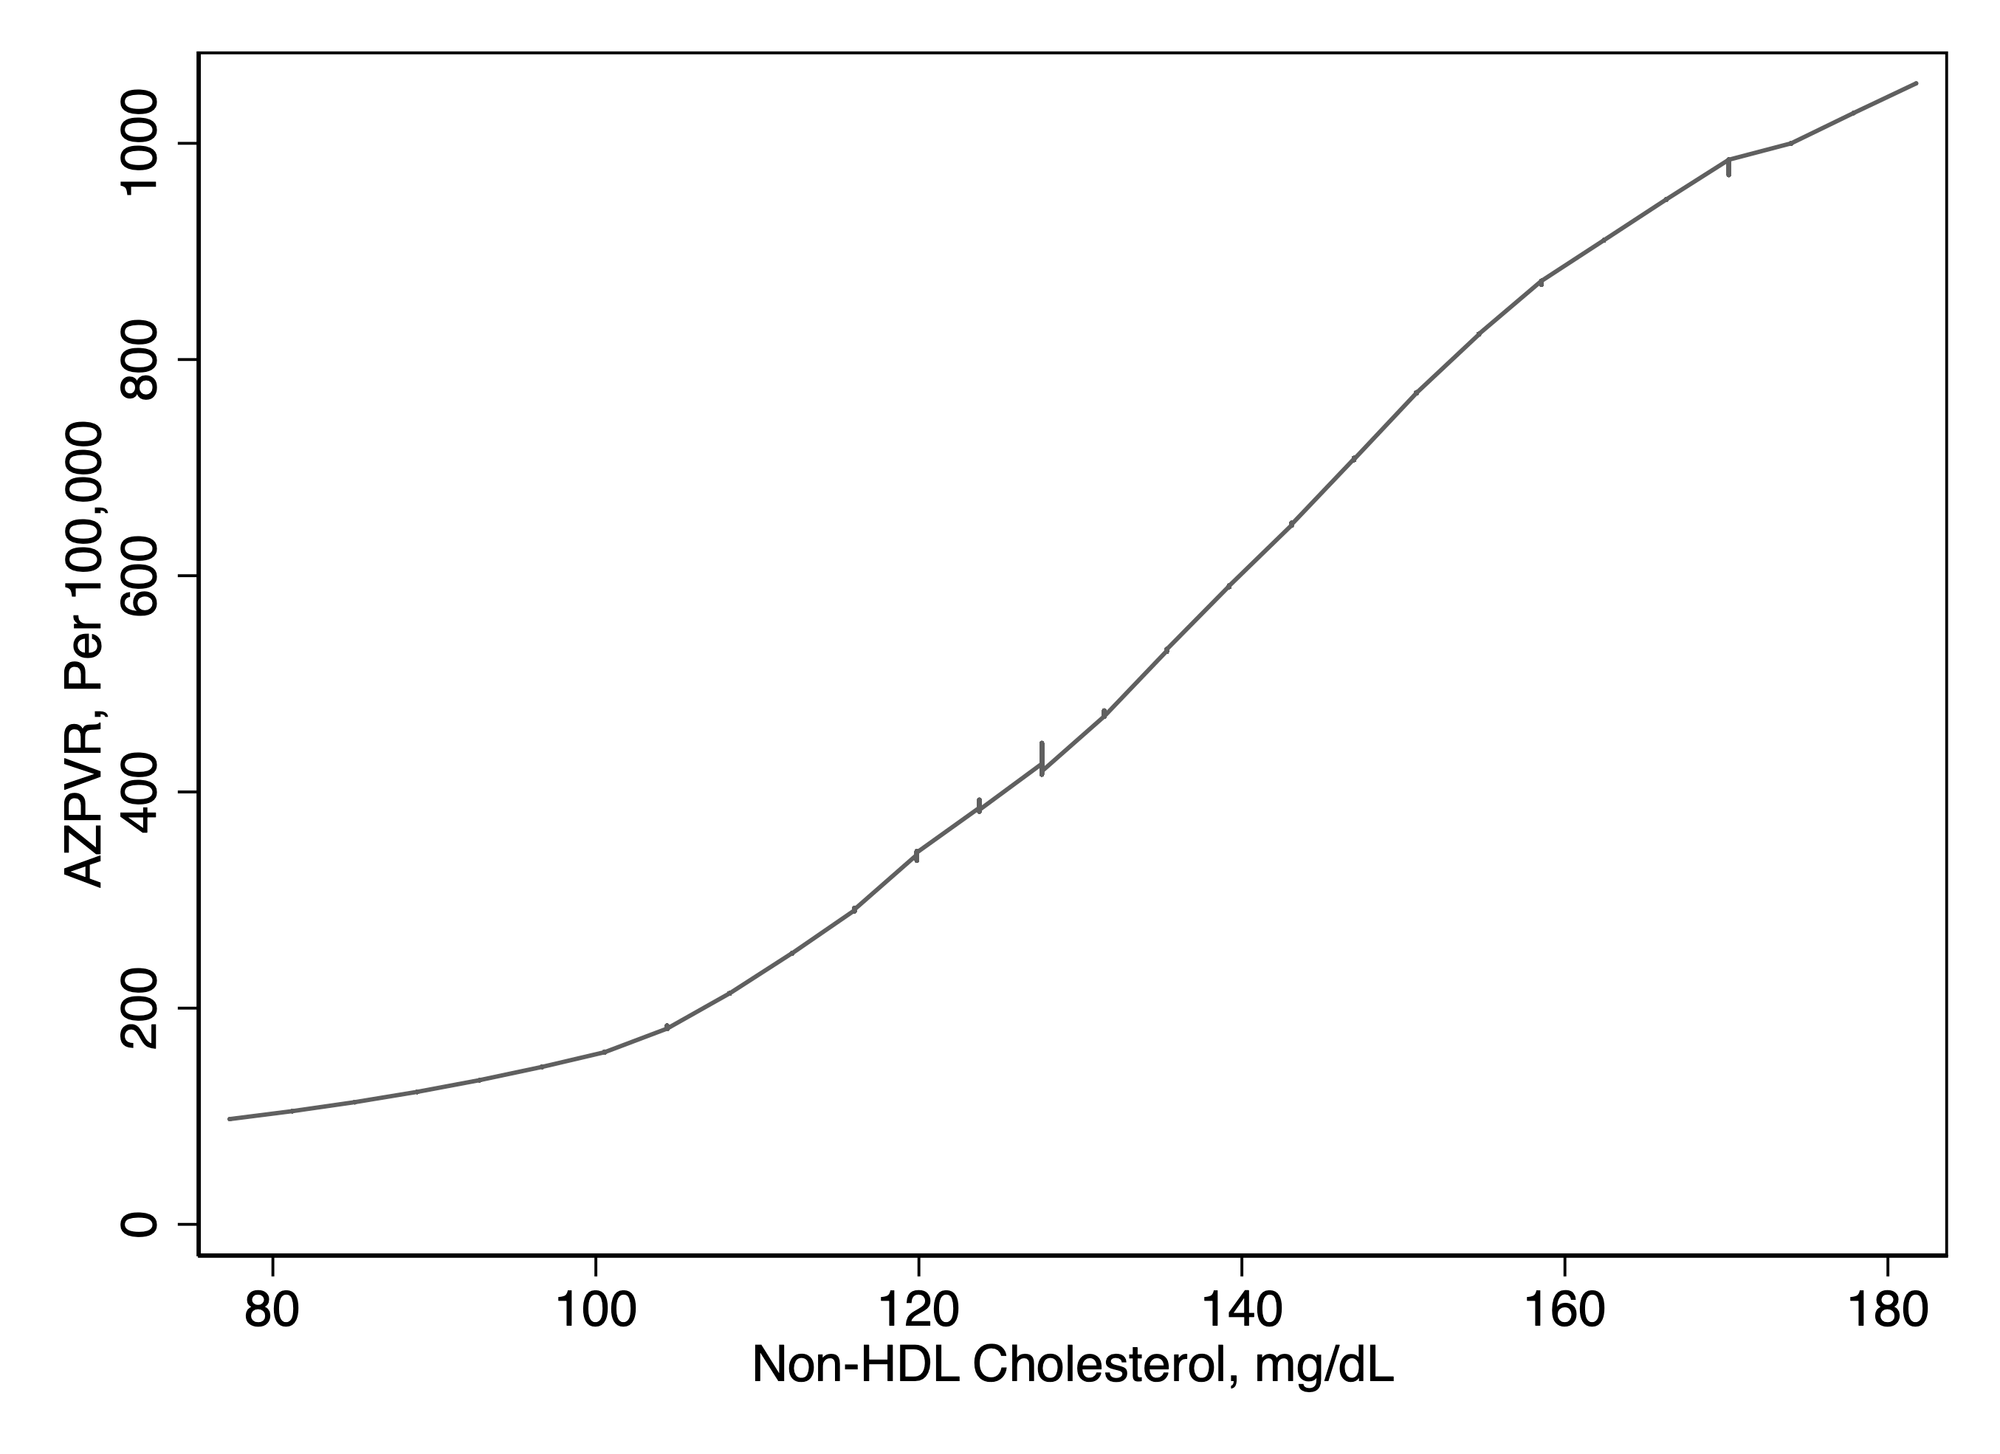
Figure 4-4 provides a more detailed breakdown by displaying the relationship for individual countries. The scatter plot is divided into different income groups (Low Income, Low-Middle, Middle, Middle-Upper, Upper), allowing for a comparative analysis across economic strata.InterpretationThese findings indicate a significant positive relationship between non-HDL cholesterol levels and the prevalence of Alzheimer's disease. This relationship is more pronounced in higher-income countries, possibly due to lifestyle factors, diet, and longer life expectancy, which can contribute to both higher cholesterol levels and a higher prevalence of Alzheimer's disease.ImplicationsUnderstanding this relationship has crucial implications for public health policy. Interventions aimed at reducing non-HDL cholesterol through dietary changes, lifestyle modifications, and medication could potentially lower the prevalence of Alzheimer's disease. These findings emphasize the importance of cardiovascular health in the context of neurological disorders and suggest that comprehensive health strategies should address both heart and brain health simultaneously.In conclusion, the positive correlation between non-HDL cholesterol and Alzheimer's disease prevalence underscores the interconnectedness of cardiovascular and neurological health, highlighting the need for integrated health approaches to mitigate the risk and impact of Alzheimer's disease globally.
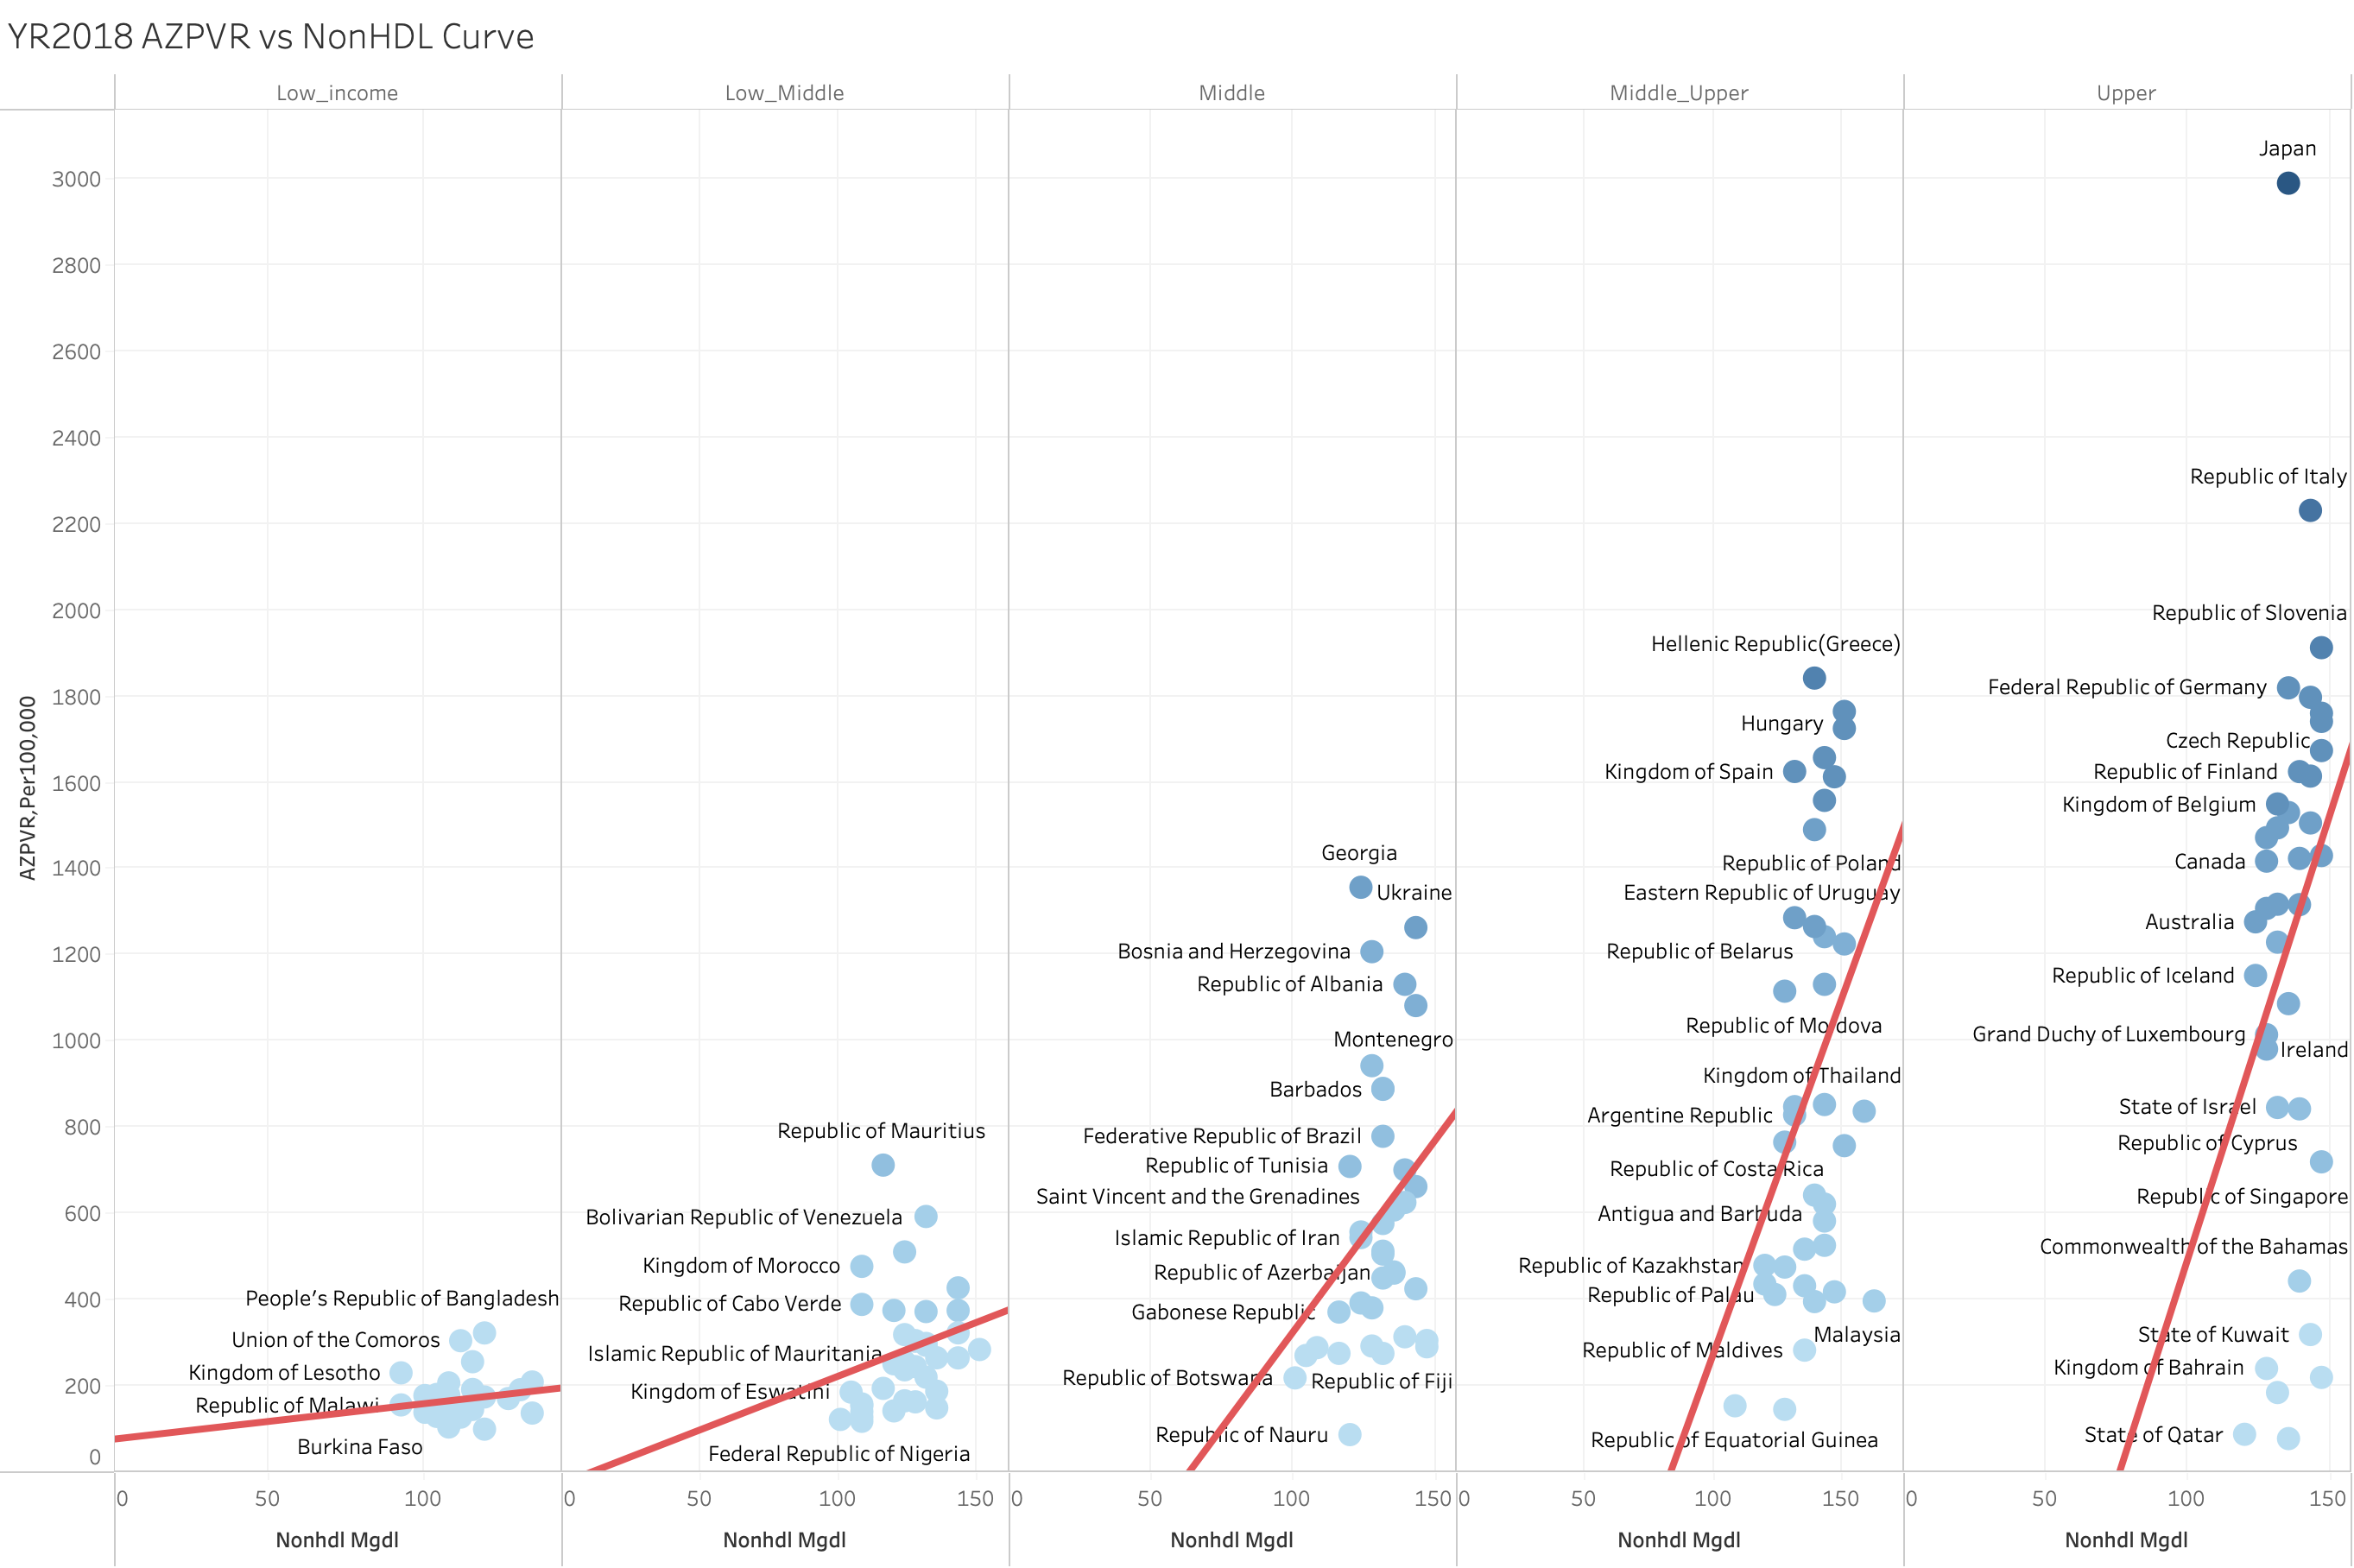
- Low Income and Low-Middle Income: Countries in these categories generally have lower non-HDL cholesterol levels and corresponding lower AZPVR. The trend lines in these sections are relatively flat, indicating a less pronounced relationship between non-HDL cholesterol and Alzheimer's prevalence.
- Middle and Middle-Upper Income: As we move to middle and middle-upper income countries, there is a noticeable increase in both non-HDL cholesterol levels and AZPVR. The trend lines become steeper, reflecting a stronger positive correlation between these variables.
- Upper Income: In high-income countries, the relationship is even more pronounced. Countries like Japan and Italy exhibit significantly higher non-HDL cholesterol levels and much higher AZPVR. The steep upward trend lines in this section suggest a robust positive association.
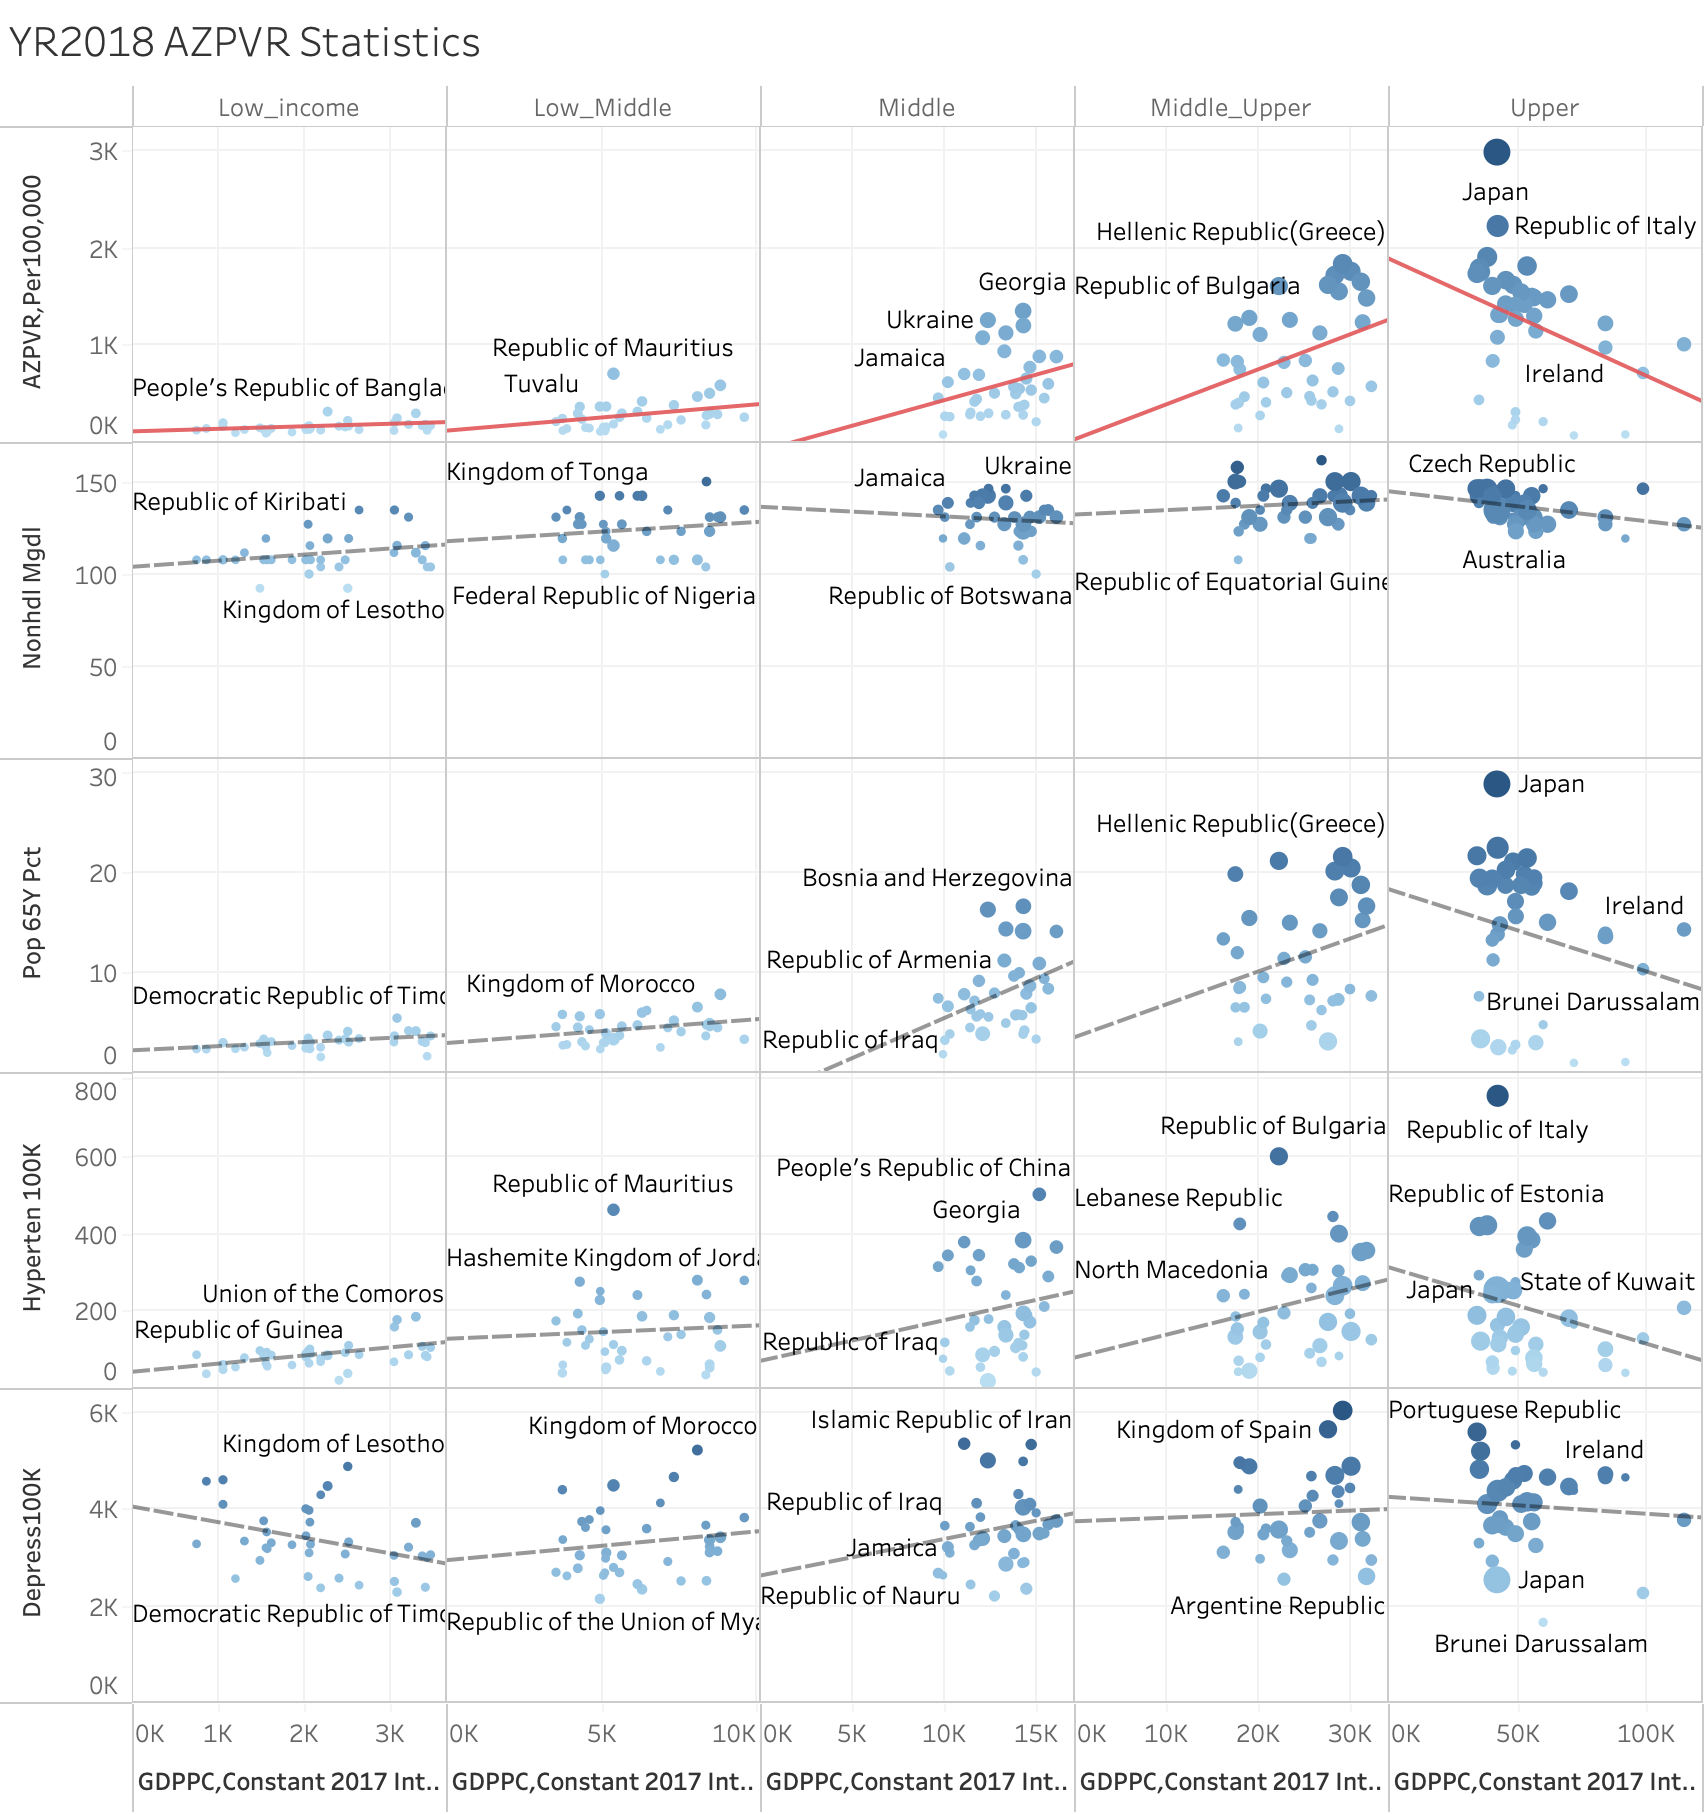
Alzheimer's Disease Prevalence Rate (AZPVR) Statistics ( YR2018 )
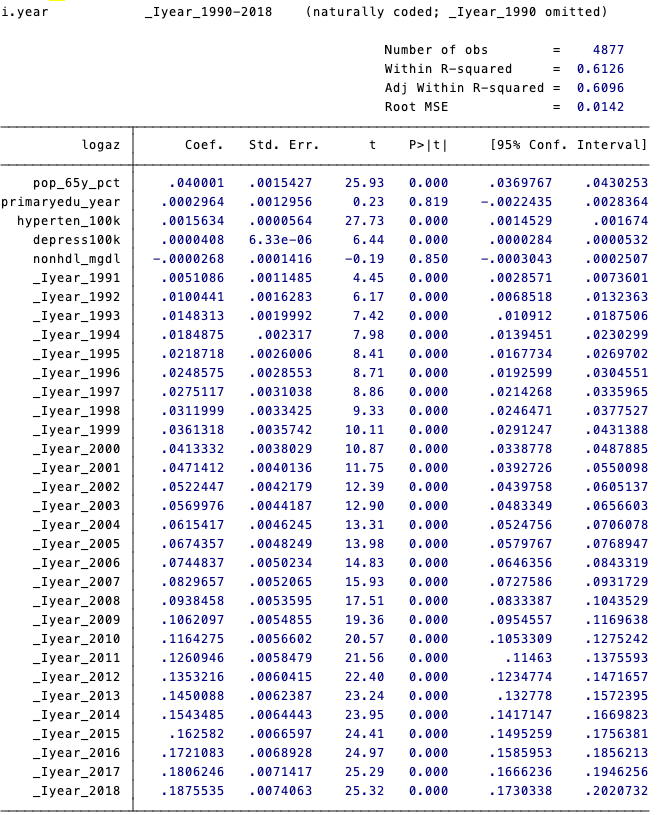
Figure 4-5 shows the relationship between the prevalence rate of Alzheimer's disease (AZPVR) and various health and economic indicators in countries of different income levels for the year 2018. The chart is divided into six sections, each representing an income category (Low Income, Low-Middle Income, Middle Income, Middle-Upper Income, Upper Income), and correlates AZPVR with indicators such as non-HDL cholesterol, percentage of the population aged 65 and over, hypertension prevalence, depression prevalence relationships within Income Categories
Low Income:
- Non-HDL Cholesterol (Non-HDL Mg/dL): Shows a weak positive correlation with AZPVR.
- Population Aged 65+ Percentage (Pop 65Y Pct): Displays a flat trend, indicating a minimal impact of aging on AZPVR in low-income countries.
- Hypertension Prevalence (Hyperten_100K): No significant trend, suggesting hypertension has a negligible effect on AZPVR in low-income countries.
- Depression Prevalence (Depress100K): Shows a positive correlation, with higher depression rates often accompanying higher AZPVR.
Low-Middle Income:
- Non-HDL Cholesterol: Shows a slight upward trend, indicating some positive correlation with AZPVR.
- Population Aged 65+ Percentage: Shows a slight upward trend, indicating some positive correlation with AZPVR.
- Hypertension Prevalence: Shows no significant trend.
- Depression Prevalence: Shows a slight positive correlation.
Middle Income:
- Non-HDL Cholesterol: Shows a more significant positive correlation, with higher non-HDL cholesterol levels associated with higher AZPVR.
- Population Aged 65+ Percentage: Shows a significant positive correlation, indicating a stronger impact of aging on AZPVR.
- Hypertension Prevalence: Shows a positive correlation.
- Depression Prevalence: Shows a significant positive correlation.
Middle-Upper Income:
- Non-HDL Cholesterol: Shows a significant positive correlation.
- Population Aged 65+ Percentage: Shows a significant positive correlation, indicating a stronger impact of aging on AZPVR.
- Hypertension Prevalence: Shows a positive correlation.
- Depression Prevalence: Shows a significant positive correlation.
Upper Income:
- Non-HDL Cholesterol: Shows a very strong positive correlation, particularly in countries like Japan and Italy, which exhibit high non-HDL cholesterol and high AZPVR.
- Population Aged 65+ Percentage: Shows a very strong positive correlation, particularly in Japan.
- Hypertension Prevalence: Shows a positive correlation.
- Depression Prevalence: Shows a significant positive correlation.
Conclusion
Our comprehensive analysis of data spanning 183 countries from 1900 to 2018 reveals an intriguing pattern regarding the prevalence rate of Alzheimer’s disease (AZ). We observe that in developed countries, the prevalence rate of AZ decreases as income levels increase, indicating a negative correlation between income and AZ prevalence. Conversely, in middle- to low-income countries, we find a contrasting trend where the prevalence rate of AZ tends to increase with rising income levels.
This phenomenon aligns with the concept of the Kuznets Curve, which posits an inverted U-shaped relationship between economic development and certain social indicators. In the context of Alzheimer’s disease prevalence, our findings suggest that as countries transition from low to high income, there is initially an increase in AZ prevalence, followed by a decline as income levels continue to rise.
Implications of the Findings
The implications of these findings are profound. They underscore the complex relationship between economic development and health outcomes, particularly in the context of chronic diseases such as Alzheimer’s disease. The initial rise in AZ prevalence in low- and middle-income countries can be attributed to several factors:
- Improved Diagnostic Capabilities: As countries develop, their healthcare systems often improve, leading to better diagnostic capabilities. This increased ability to diagnose Alzheimer’s disease may result in higher reported prevalence rates, even if the actual incidence remains constant. ( 診斷能力改善 )
- Aging Population: Economic development often leads to increased life expectancy. As populations age, the prevalence of age-related diseases like Alzheimer’s naturally increases. This demographic shift is particularly pronounced in countries undergoing rapid economic transitions. ( 人口老化 )
- Lifestyle Changes: Economic development can bring about significant lifestyle changes, some of which may increase the risk of Alzheimer’s disease. For example, dietary changes, reduced physical activity, and increased exposure to pollution and other environmental risk factors can contribute to higher rates of chronic diseases. ( 生活方式的改變 )
- Urbanization: Rapid urbanization, often associated with economic growth, can lead to increased stress and social isolation, both of which are risk factors for Alzheimer’s disease. ( 都市化 )
Policy Recommendations
Given these insights, it is crucial for policymakers to adopt targeted interventions to address the growing burden of Alzheimer’s disease, particularly in low- and middle-income countries. The following policy recommendations are suggested:
- Strengthening Healthcare Infrastructure: Investment in healthcare infrastructure is essential to improve diagnostic and treatment capabilities for Alzheimer’s disease. This includes training healthcare professionals, improving access to diagnostic tools, and expanding healthcare facilities. ( 醫療基礎設施)
- Promoting Healthy Lifestyles: Public health campaigns to promote healthy lifestyles can help mitigate some of the risk factors associated with economic development. These campaigns should focus on promoting balanced diets, regular physical activity, and reducing exposure to environmental pollutants. ( 健康促進 )
- Supporting Aging Populations: Social policies that support the aging population, such as pension systems, affordable healthcare, and community support programs, can help reduce the burden of Alzheimer’s disease. Ensuring that older adults have access to necessary healthcare services and social support can improve their quality of life and reduce the prevalence of chronic diseases. ( 老年福利支持)
- Research and Development: Continued research into the underlying mechanisms of Alzheimer’s disease is essential. This includes genetic studies, research into environmental risk factors, and the development of new diagnostic and treatment methods. Governments and private sectors should invest in research to better understand and combat Alzheimer’s disease. ( 研發資源 )
- International Collaboration: Alzheimer’s disease is a global challenge that requires international cooperation. Countries can benefit from sharing research, resources, and best practices. International organizations, such as the World Health Organization (WHO), can play a pivotal role in facilitating this collaboration. ( 國際合作)
Further Research
Further research into the underlying mechanisms driving these trends is warranted to inform effective prevention and management strategies. Several areas of research are particularly promising:
Genetic Factors: Understanding the genetic predispositions that contribute to Alzheimer’s disease can help in developing targeted treatments. Large-scale genetic studies across diverse populations can provide insights into how genetic factors interact with environmental and lifestyle factors. ( 遺傳因素 )
Environmental Influences: Research into how environmental factors, such as air pollution, dietary patterns, and exposure to toxins, influence the development of Alzheimer’s disease can inform public health policies aimed at reducing these risks. ( 環境影響)
Early Detection and Intervention: Developing methods for early detection of Alzheimer’s disease can significantly improve outcomes. Research into biomarkers and advanced imaging techniques can aid in identifying the disease at its earliest stages, allowing for timely interventions. ( 早期檢測及干預 )
Cultural and Social Factors: Understanding how cultural and social factors influence the perception and management of Alzheimer’s disease can help in designing more effective public health interventions. Studies focusing on different cultural contexts can provide valuable insights into how to tailor interventions to specific populations. ( 文化及社會因素 )
In conclusion, our study provides valuable insights into the relationship between economic development and the prevalence of Alzheimer’s disease. The observed trends underscore the need for a multifaceted approach to address the growing burden of this disease. Policymakers must consider the complex interplay between economic growth, healthcare infrastructure, and social support systems to effectively manage and reduce the prevalence of Alzheimer’s disease.
The findings highlight the importance of investing in healthcare infrastructure and public health education in developing countries to mitigate the initial rise in Alzheimer’s prevalence. By understanding this nuanced relationship, policymakers can better design interventions to manage and potentially reduce the burden of Alzheimer’s disease as economies grow.
As we move forward, it is crucial to continue researching the underlying mechanisms of Alzheimer’s disease and to develop strategies that address both the medical and social aspects of the disease. Through targeted interventions, international collaboration, and ongoing research, we can make significant strides in reducing the global burden of Alzheimer’s disease and improving the quality of life for millions of individuals affected by this condition.
Appendix I semipar regression data
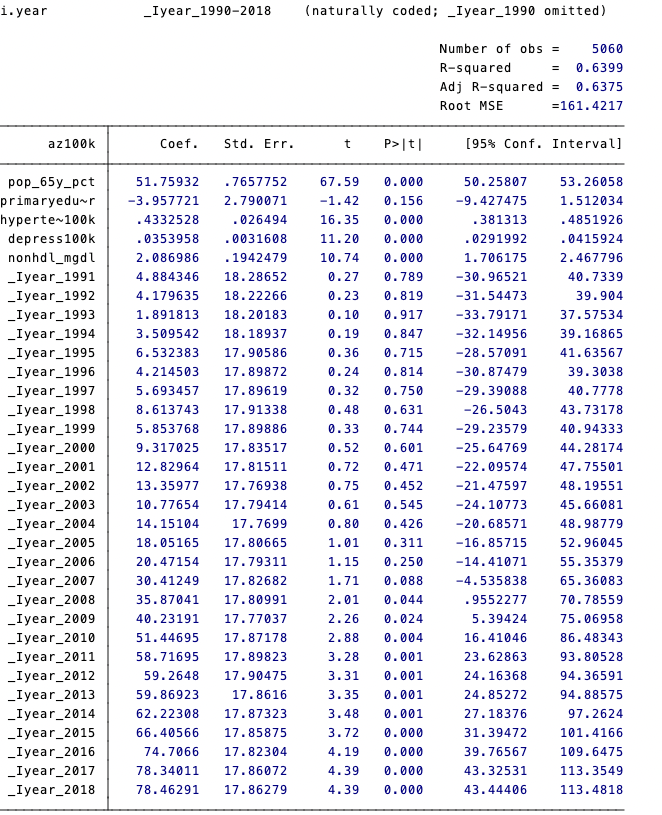
Appendix II xtsemipar regression data
Reference
- Alzheimer’s Association. (2024). Economic Impact of Alzheimer's Disease.
- Baltagi, B. H. (2005). Econometric Analysis of Panel Data. John Wiley & Sons.
- Baltagi, B. H., & Li, D. (2002). Series Estimation of Partially Linear Panel Data Models with Fixed Effects. Annals of Economics and Finance, 3, 103-120.
- Blakely, T., Atkinson, J., & O'Dea, D. (2005). No association of income inequality with adult mortality within New Zealand: a multi-level study of 1.4 million 25-64 year olds. Journal of Epidemiology & Community Health, 59(1), 12-16.
- Chandra, A., et al. (2023). Cost of Long-Term Care.
- Chandra, Amitabh, Courtney Coile, and Corina Mommaerts. 2023. "What Can Economics Say about Alzheimer's Disease?" Journal of Economic Literature, 61 (2): 428-70.
- Cutler, D. M., Deaton, A. S., & Lleras-Muney, A. (2006). The determinants of mortality. Journal of Economic Perspectives, 20(3), 97-120.
- Deaton, A. (2003). Health, inequality, and economic development. Journal of Economic Literature, 41(1), 113-158.
- Egger, M., Davey Smith, G., & Grundy, C. (1995). Health inequalities and the ‘U-shaped curve’. Journal of Epidemiology & Community Health, 49(10), 10-18.
- Global Burden of Disease Collaborative Network, Global Burden of Disease Study 2019 (GBD 2019) Results (2020, Institute for Health Metrics and Evaluation – IHME).
- Härdle, W., & Mammen, E. (1993). Comparing nonparametric versus parametric regression fits. The Annals of Statistics, 21(4), 1926-1947.
- Kuznets, S. (1955). Economic growth and income inequality. American Economic Review, 45(1), 1-28.
- Mackenbach, J. P. (2012). The persistence of health inequalities in modern welfare states: The explanation of a paradox. Social Science & Medicine, 75(4), 761-769.
- Popkin, B. M. (1993). Nutritional patterns and transitions. Population and Development Review, 19(1), 138-157.
- Popkin, B. M. (2001). The nutrition transition and obesity in the developing world. Journal of Nutrition, 131(3), 871S-873S.
- Prince, M., Wimo, A., Guerchet, M., Ali, G. C., Wu, Y. T., & Prina, M. (2015). World Alzheimer Report 2015: The Global Impact of Dementia. Alzheimer's Disease International (ADI).
- Robinson, P. M. (1988). Root-N-consistent semiparametric regression. Econometrica, 56(4), 931-954.
- Ruppert, D., Wand, M. P., & Carroll, R. J. (2003). Semiparametric Regression. Cambridge University Press.
- Wilkinson, R. G., & Pickett, K. E. (2006). Income inequality and population health: A review and explanation of the evidence. Social Science & Medicine, 62(7), 1768-1784.
- Yusuf, S., Reddy, S., Ounpuu, S., & Anand, S. (2001). Global burden of cardiovascular diseases: part I: general considerations, the epidemiologic transition, risk factors, and impact of urbanization. Circulation, 104(22), 2746-2753.