# Import necessary libraries
import pandas as pd
import numpy as np
import matplotlib.pyplot as plt
import seaborn as sns
from google.colab import drive
# Mount Google Drive
drive.mount('/content/drive')
# Load the data
file_path = '/content/drive/My Drive/dataset/az_0704.csv'
data = pd.read_csv(file_path)
# Descriptive statistics
desc_stats = data.describe()
print("Descriptive Statistics:")
print(desc_stats)
# Box plot to visualize distribution and check for outliers
plt.figure(figsize=(16, 10))
sns.boxplot(data=data.select_dtypes(include=[np.number])) # Only plot numerical columns
plt.xticks(rotation=90)
plt.title('Box Plot of Features')
plt.show()
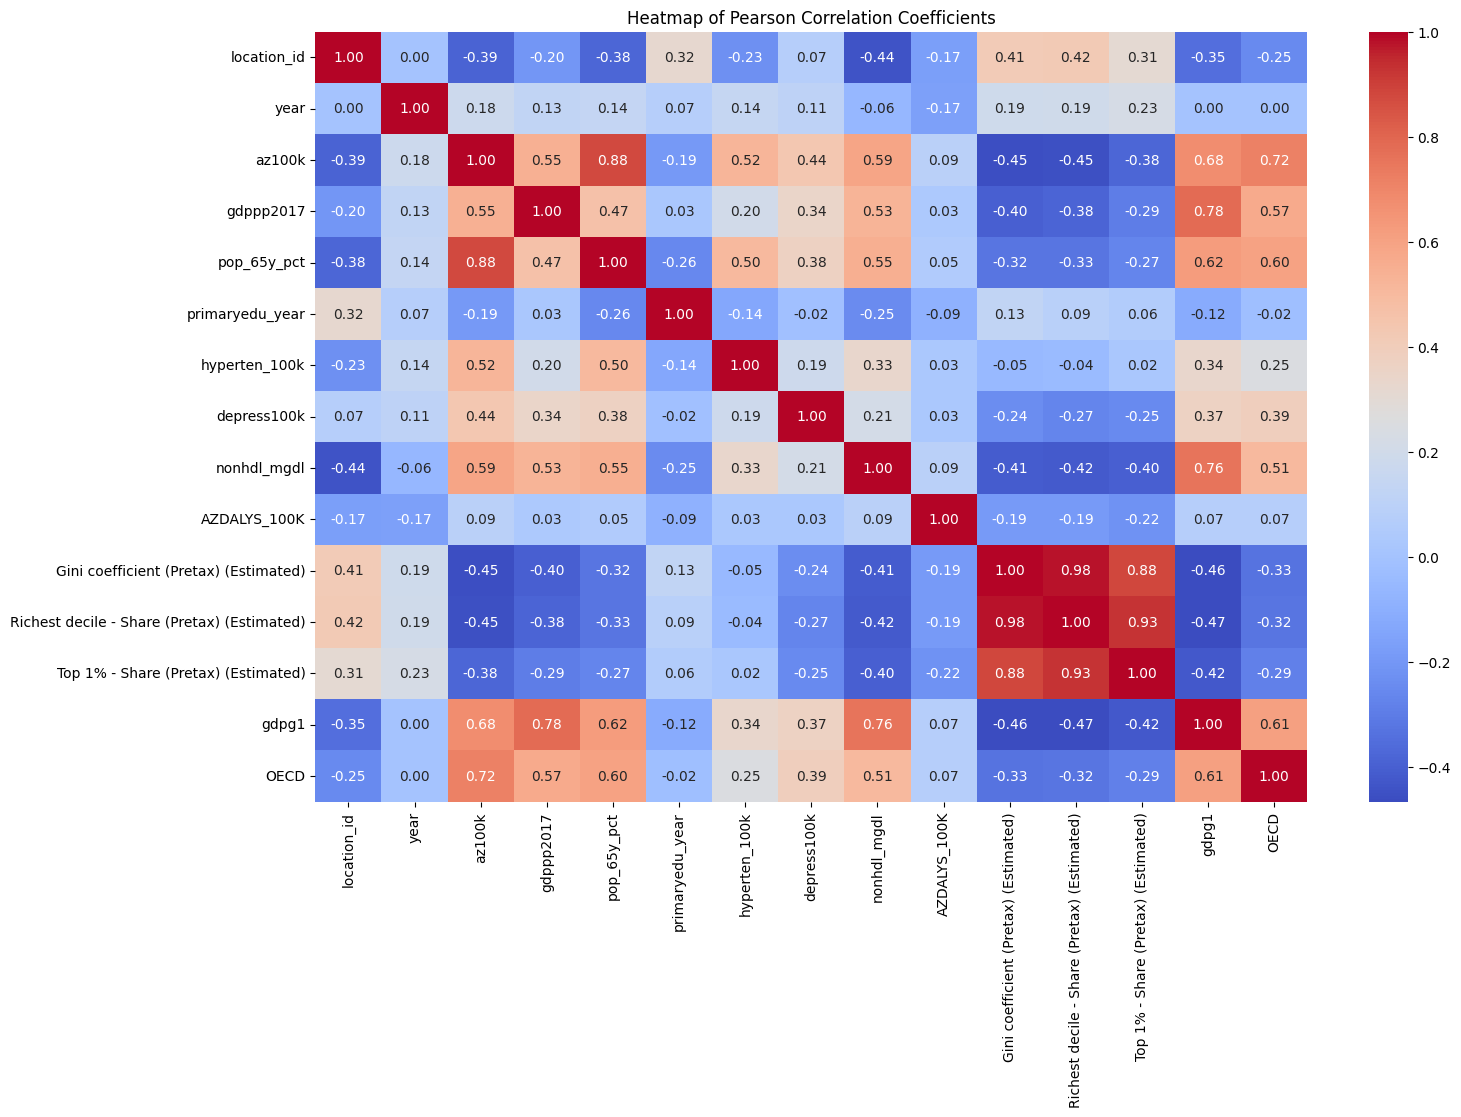
# Pearson correlation coefficient
numerical_data = data.select_dtypes(include=[np.number]) # Select only numerical columns
correlation_matrix = numerical_data.corr(method='pearson')
# Heatmap to visualize correlation between variables
plt.figure(figsize=(16, 10))
sns.heatmap(correlation_matrix, annot=True, fmt='.2f', cmap='coolwarm')
plt.title('Heatmap of Pearson Correlation Coefficients')
plt.show()
Descriptive Statistics:
       location_id         year       az100k      gdppp2017  pop_65y_pct  \
count  5278.000000  5278.000000  5278.000000    5084.000000  5277.000000
mean    121.653846  2004.000000   482.064222   16294.764183     6.783686
std      79.268908     8.367393   416.042637   18744.217062     4.976065
min       6.000000  1990.000000    33.614658     430.413544     0.170000
25%      60.000000  1997.000000   166.808465    3323.306472     3.180000
50%     115.500000  2004.000000   302.029322    9404.266637     4.560000
75%     173.000000  2011.000000   715.899212   21989.983638     9.760000
max     522.000000  2018.000000  2989.455411  120647.823000    28.900000

       primaryedu_year  hyperten_100k  depress100k  nonhdl_mgdl  AZDALYS_100K  \
count      5256.000000    5278.000000  5278.000000  5278.000000   5278.000000
mean          5.715373     146.414885  3465.718431   130.069746    308.305664
std           0.912770     102.381942   861.010131    20.029327    268.414948
min           3.000000      15.575297  1425.210658    77.339520     23.282751
25%           5.000000      75.126248  2826.171856   112.142305    115.806096
50%           6.000000     112.906913  3334.594173   131.477185    199.230829
75%           6.000000     190.788855  4035.816012   143.078113    433.587815
max           9.000000     767.819542  7113.698255   181.747873   1843.962872

       Gini coefficient (Pretax) (Estimated)  \
count                            1446.000000
mean                               50.406392
std                                 9.317352
min                                29.731230
25%                                43.604179
50%                                48.478420
75%                                55.305236
max                                76.166683

       Richest decile - Share (Pretax) (Estimated)  \
count                                  1446.000000
mean                                     38.925754
std                                       9.243309
min                                      22.710000
25%                                      32.222503
50%                                      35.915000
75%                                      44.267501
max                                      67.830000

       Top 1% - Share (Pretax) (Estimated)        gdpg1         OECD
count                          1446.000000  5278.000000  5278.000000
mean                             13.013458     2.000000     0.208791
std                               4.892647     1.422097     0.406483
min                               3.680000     0.000000     0.000000
25%                               9.670000     1.000000     0.000000
50%                              11.460000     2.000000     0.000000
75%                              15.595000     3.000000     0.000000
max                              35.870000     4.000000     1.000000

