Stock Price Predict using LSTM.3231_180D


import pandas as pd
import matplotlib.pyplot as plt
import numpy as np
from sklearn.preprocessing import MinMaxScaler
from tensorflow.keras.models import Sequential
from tensorflow.keras.layers import Dense
from tensorflow.keras.layers import LSTM
import math
from sklearn.metrics import mean_squared_error
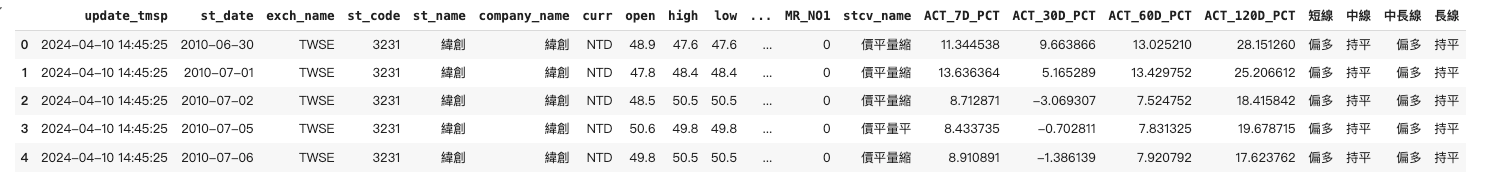
df = pd.read_csv('/content/3231_0614t.csv')
df.head()
from google.colab import drive
drive.mount('/content/drive')

df2 = df.reset_index()['close']
plt.plot(df2) 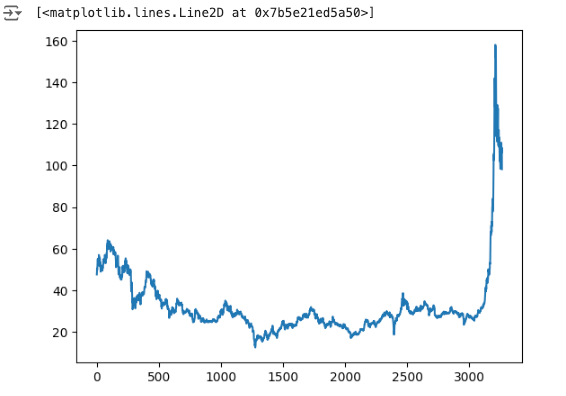
scaler = MinMaxScaler()
df2 = scaler.fit_transform(np.array(df2).reshape(-1,1))
df2.shape 
train_size = int(len(df2)*0.65)
test_size = len(df2) - train_size
train_data,test_data = df2[0:train_size,:],df2[train_size:len(df2),:1]
def create_dataset(dataset, time_step = 1):
dataX,dataY = [],[]
for i in range(len(dataset)-time_step-1):
a = dataset[i:(i+time_step),0]
dataX.append(a)
dataY.append(dataset[i + time_step,0])
return np.array(dataX),np.array(dataY)# calling the create dataset function to split the data into
# input output datasets with time step 100
time_step = 100
X_train,Y_train = create_dataset(train_data,time_step)
X_test,Y_test = create_dataset(test_data,time_step) # checking values
print(X_train.shape)
print(X_train)
print(X_test.shape)
print(Y_test.shape) 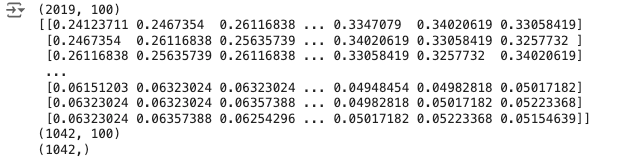
model = Sequential()
model.add(LSTM(50,return_sequences = True,input_shape = (X_train.shape[1],1)))
model.add(LSTM(50,return_sequences = True))
model.add(LSTM(50))
model.add(Dense(1))
model.compile(loss = 'mean_squared_error',optimizer = 'adam')
model.summary() 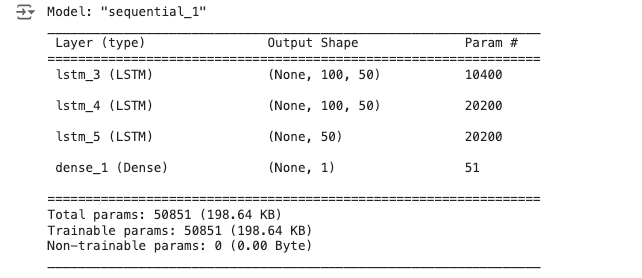
model.fit(X_train,Y_train,validation_data = (X_test,Y_test),epochs = 10,batch_size = 64,verbose = 1)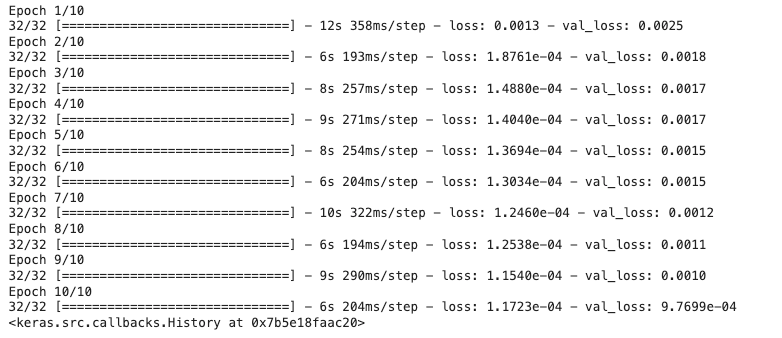
from tensorflow.keras.models import Sequential
train_predict = model.predict(X_train)
test_predict = model.predict(X_test) 
# transform to original form
train_predict = scaler.inverse_transform(train_predict)
test_predict = scaler.inverse_transform(test_predict)
print(math.sqrt(mean_squared_error(Y_train,train_predict)))
print(math.sqrt(mean_squared_error(Y_test,test_predict))) 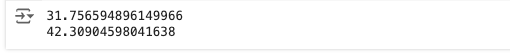
look_back = 100
testPredictPlot = np.empty_like(df2)
testPredictPlot[:,:] = np.nan
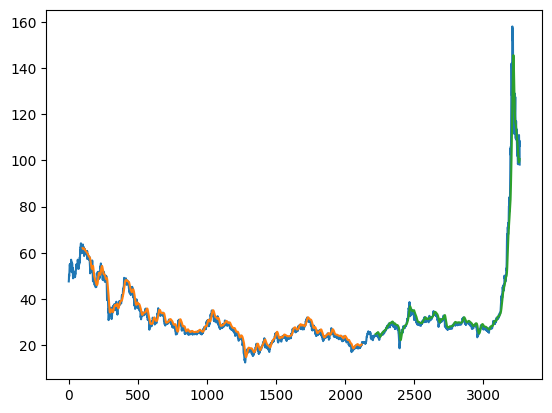
testPredictPlot[len(train_predict)+(look_back)*2 + 1 : len(df2) - 1,:] = test_predictHere, Orange is the TrainPredictionPlot, Green is the TestPredictionPlot and Blue is the actual dataset. Our model has predicted the stock prices very well.
plt.plot(scaler.inverse_transform(df2))
plt.plot(trainPredictPlot)
plt.plot(testPredictPlot)
plt.show()