from google.colab import drive
drive.mount('/content/drive')
import pandas as pd
import matplotlib.pyplot as plt
import seaborn as sns
from scipy import stats
# Load the data
file_path = '/content/drive/My Drive/MSCI_Taiwan_30_data_with_OBV.csv'
data = pd.read_csv(file_path)
# Descriptive statistics
descriptive_stats = data.describe()
print("Descriptive Statistics:")
print(descriptive_stats)
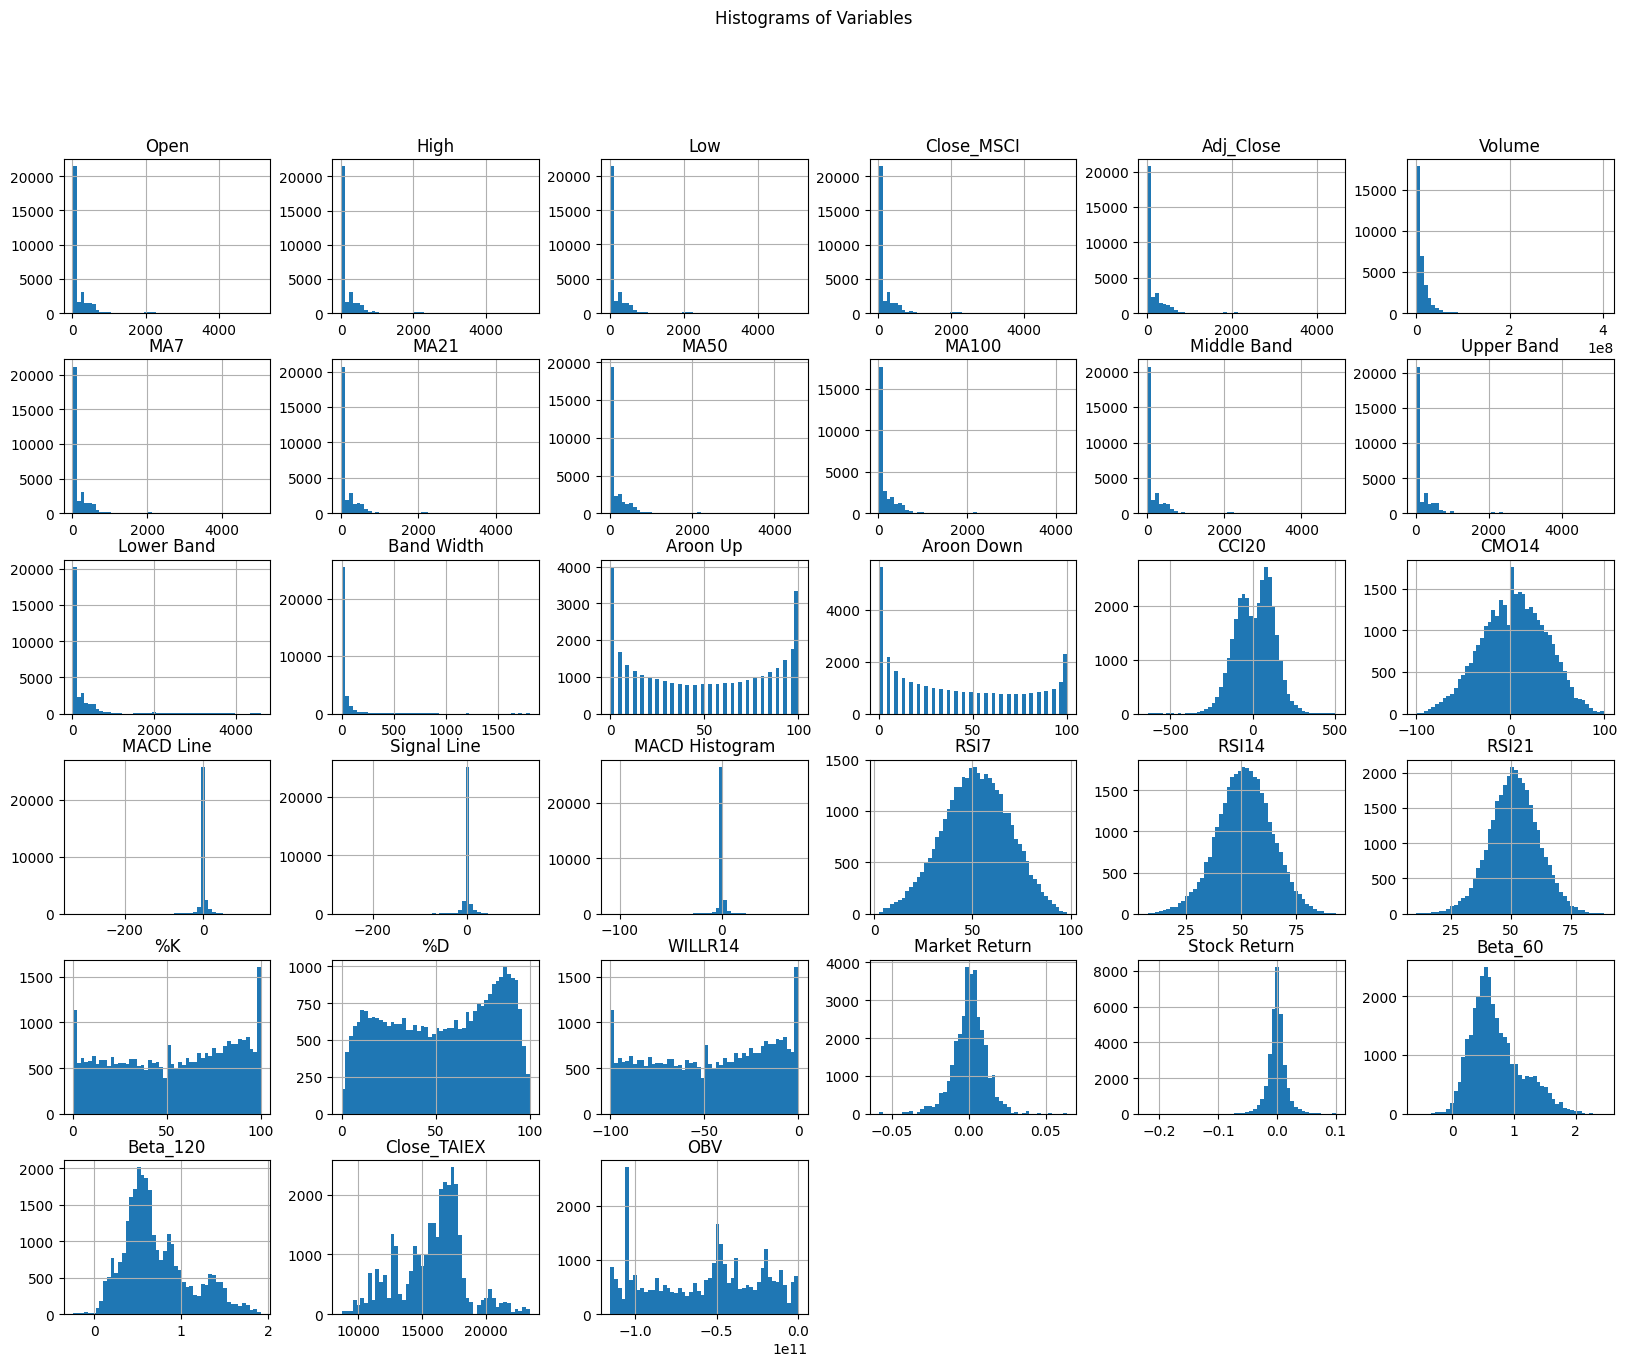
# Plot histograms
data.hist(bins=50, figsize=(20, 15))
plt.suptitle('Histograms of Variables')
plt.show()

.