0050.XGB.2nd.practice


2024-06-19
# 安裝必要的庫 XGB
!pip install yfinance xgboost
import pandas as pd
import numpy as np
import matplotlib.pyplot as plt
import yfinance as yf
from sklearn.preprocessing import MinMaxScaler
from sklearn.metrics import mean_squared_error
import xgboost as xgb
import math
# 下載0050過去5年的股價數據
ticker = '0050.TW'
stock_data = yf.download(ticker, period='5y')
stock_data.reset_index(inplace=True)
stock_data.to_csv('0050_stock_data.csv', index=False)
# 加載數據
df = pd.read_csv('0050_stock_data.csv')
df = df[['Date', 'Close']]
# 數據歸一化
scaler = MinMaxScaler(feature_range=(0, 1))
df_scaled = scaler.fit_transform(df[['Close']])
# 創建訓練和測試集
train_size = int(len(df_scaled) * 0.8)
test_size = len(df_scaled) - train_size
train_data, test_data = df_scaled[0:train_size, :], df_scaled[train_size:len(df_scaled), :]
# 創建數據集
def create_dataset(dataset, time_step=1):
dataX, dataY = [], []
for i in range(len(dataset) - time_step - 1):
a = dataset[i:(i + time_step), 0]
dataX.append(a)
dataY.append(dataset[i + time_step, 0])
return np.array(dataX), np.array(dataY)
time_step = 100
X_train, Y_train = create_dataset(train_data, time_step)
X_test, Y_test = create_dataset(test_data, time_step)
# 構建XGBoost模型
model = xgb.XGBRegressor(objective='reg:squarederror', n_estimators=100, learning_rate=0.1, max_depth=5)
# 訓練模型
model.fit(X_train, Y_train)
# 預測數據
train_predict = model.predict(X_train)
test_predict = model.predict(X_test)
# 反歸一化預測結果
train_predict = scaler.inverse_transform(train_predict.reshape(-1, 1))
test_predict = scaler.inverse_transform(test_predict.reshape(-1, 1))
Y_train = scaler.inverse_transform(Y_train.reshape(-1, 1))
Y_test = scaler.inverse_transform(Y_test.reshape(-1, 1))
# 計算RMSE
train_rmse = math.sqrt(mean_squared_error(Y_train, train_predict))
test_rmse = math.sqrt(mean_squared_error(Y_test, test_predict))
print(f'Train RMSE: {train_rmse}')
print(f'Test RMSE: {test_rmse}')
# 繪製結果
import matplotlib.dates as mdates
# 確保日期列的格式正確
df['Date'] = pd.to_datetime(df['Date'])
# 繪製訓練數據的預測結果
train_predict_plot = np.empty_like(df_scaled)
train_predict_plot[:, :] = np.nan
train_predict_plot[time_step:len(train_predict) + time_step, :] = train_predict
# 繪製測試數據的預測結果
test_predict_plot = np.empty_like(df_scaled)
test_predict_plot[:, :] = np.nan
test_predict_plot[len(train_predict) + (time_step * 2) + 1:len(df_scaled) - 1, :] = test_predict
# 預測未來180天
future_days = 180
temp_input = list(test_data[-time_step:].flatten())
# 確保 temp_input 的長度正確
assert len(temp_input) == time_step, f"temp_input 的長度不正確:{len(temp_input)},應該是 {time_step}"
# 迭代預測未來的數據
future_predictions = []
for i in range(future_days):
if len(temp_input) > time_step:
temp_input = temp_input[-time_step:]
try:
input_data = np.array(temp_input).reshape((1, time_step))
except ValueError as e:
print(f"Error at iteration {i}: {e}")
print(f"temp_input: {temp_input}")
break
future_prediction = model.predict(input_data)
temp_input.append(future_prediction[0])
future_predictions.append(future_prediction[0])
# 反歸一化未來預測結果
if len(future_predictions) > 0: # 確保有未來的預測結果
future_predictions = scaler.inverse_transform(np.array(future_predictions).reshape(-1, 1))
# 繪製結果
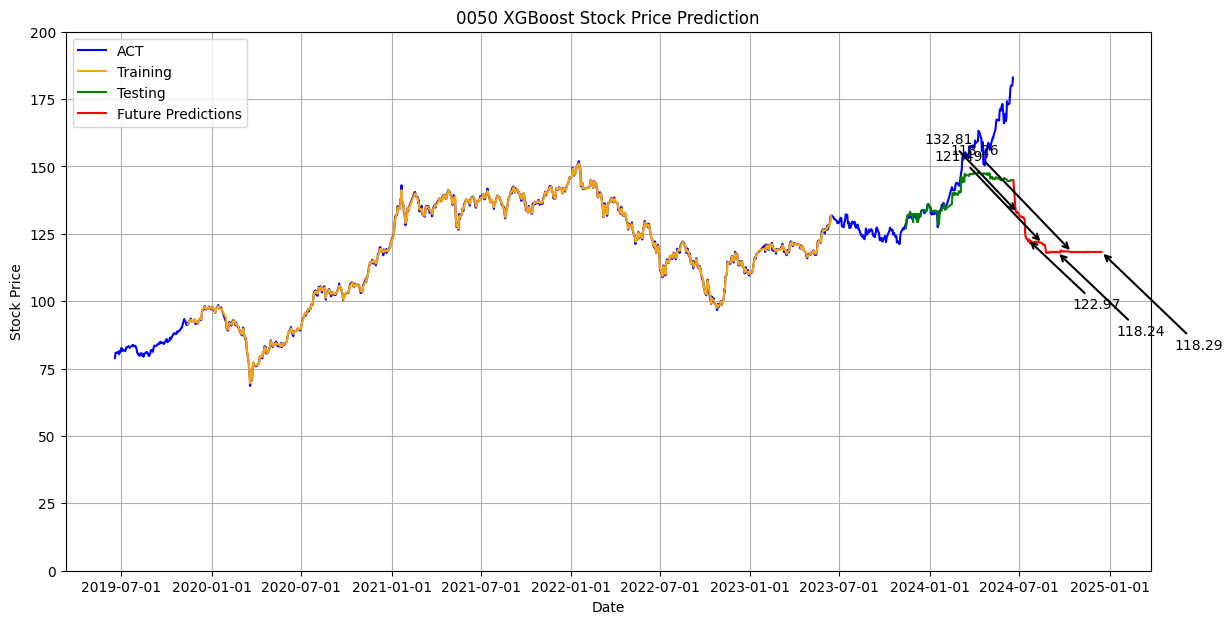
plt.figure(figsize=(14, 7))
plt.plot(df['Date'], scaler.inverse_transform(df_scaled), label='ACT', color='blue')
plt.plot(df['Date'], train_predict_plot, label='Training', color='orange')
plt.plot(df['Date'], test_predict_plot, label='Testing', color='green')
# 繪製未來180天的預測結果
future_dates = pd.date_range(start=df['Date'].iloc[-1], periods=future_days + 1).tolist()
plt.plot(future_dates[1:], future_predictions, label='Future Predictions', color='red')
# 標示特定日期的收盤價
specific_days = [10, 30, 60, 90, 120, 180]
offsets = [(-50, 50), (50, -50), (-60, 60), (60, -60), (-70, 70), (70, -70)] # 进一步增加间距
for i, day in enumerate(specific_days):
plt.annotate(f'{future_predictions[day-1][0]:.2f}',
(future_dates[day], future_predictions[day-1]),
textcoords="offset points",
xytext=offsets[i],
ha='center',
arrowprops=dict(arrowstyle='->', lw=1.5, color='black'),
color='black')
# 設置 x 軸標記為每半年
ax = plt.gca()
ax.xaxis.set_major_locator(mdates.MonthLocator(bymonth=[1, 7], bymonthday=1))
ax.xaxis.set_major_formatter(mdates.DateFormatter('%Y-%m-%d'))
# 設置 y 軸範圍
plt.ylim(0, 200)
plt.xlabel('Date')
plt.ylabel('Stock Price')
plt.title('0050 XGBoost Stock Price Prediction')
plt.legend(loc='upper left')
plt.grid(True)
plt.show()
else:
print("No future predictions to plot.")